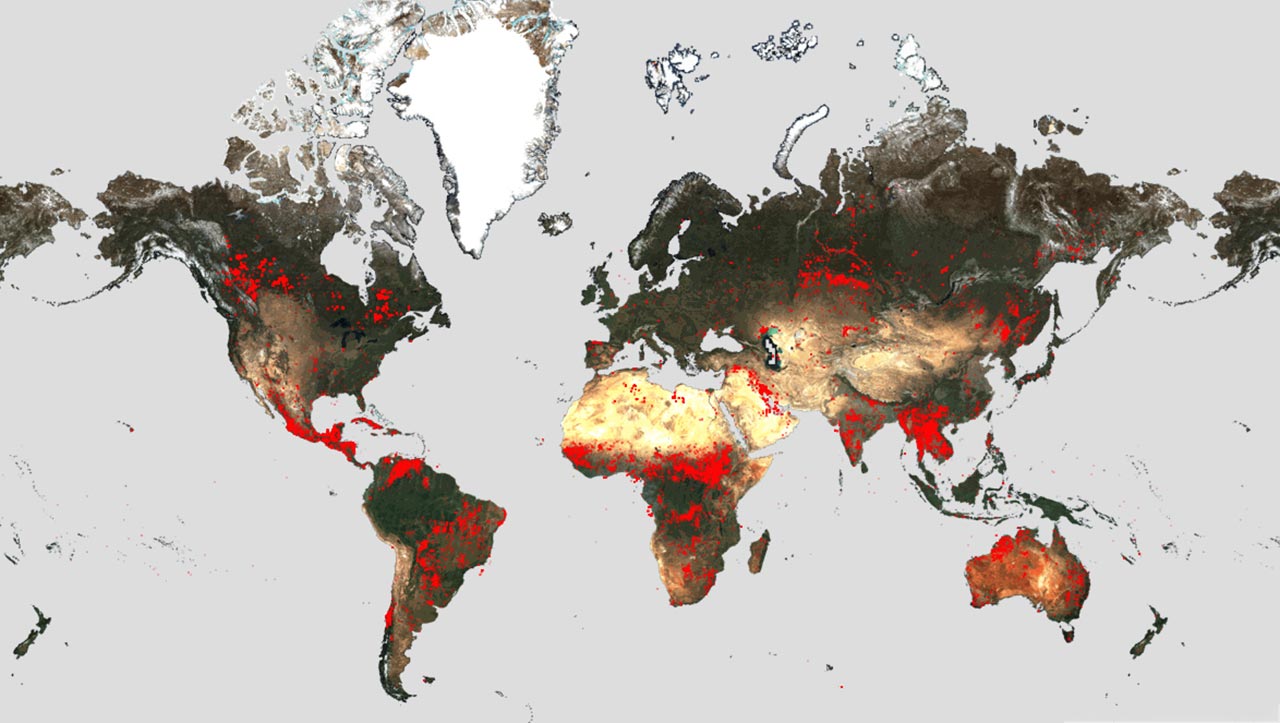
Working like a thermometer in the sky, the sensor measures thermal infrared radiation to take the temperature of Earth’s land surfaces which is used to detect the fires. Credit: ESA
Devastating wildfires in multiple countries have prompted ESA’s reopening of the World Fire Atlas, providing detailed insights and tools to monitor and manage fires globally, with Canada facing its worst wildfire season on record.
In recent weeks, devastating wildfires have spread in Greece, Italy, Spain, Portugal, Algeria, Tunisia, and Canada, causing human casualties, as well as massive environmental and economic damage.
While wildfires are a natural part of many ecosystems, scientists have warned that they are becoming more frequent and more widespread. In response, an upgraded version of ESA’s World Fire Atlas is now available providing a detailed analysis of wildfires across the globe.
Wildfires and Global Trends
Rising global temperatures and the increased frequency of extreme weather events have led to a surge in the number of wildfires rapidly consuming extensive areas of vegetation and forested lands. Countries like Greece and Italy have already experienced the devastating impact of large-scale blazes.
The European Forest Fire Information System (EFFIS) has reported that, as of July 29, 2023, more than 234,516 hectares of land across the European Union have already been burned this year alone. The situation calls for urgent attention and effective measures to combat the growing danger posed by these wildfires.
ESA’s World Fire Atlas
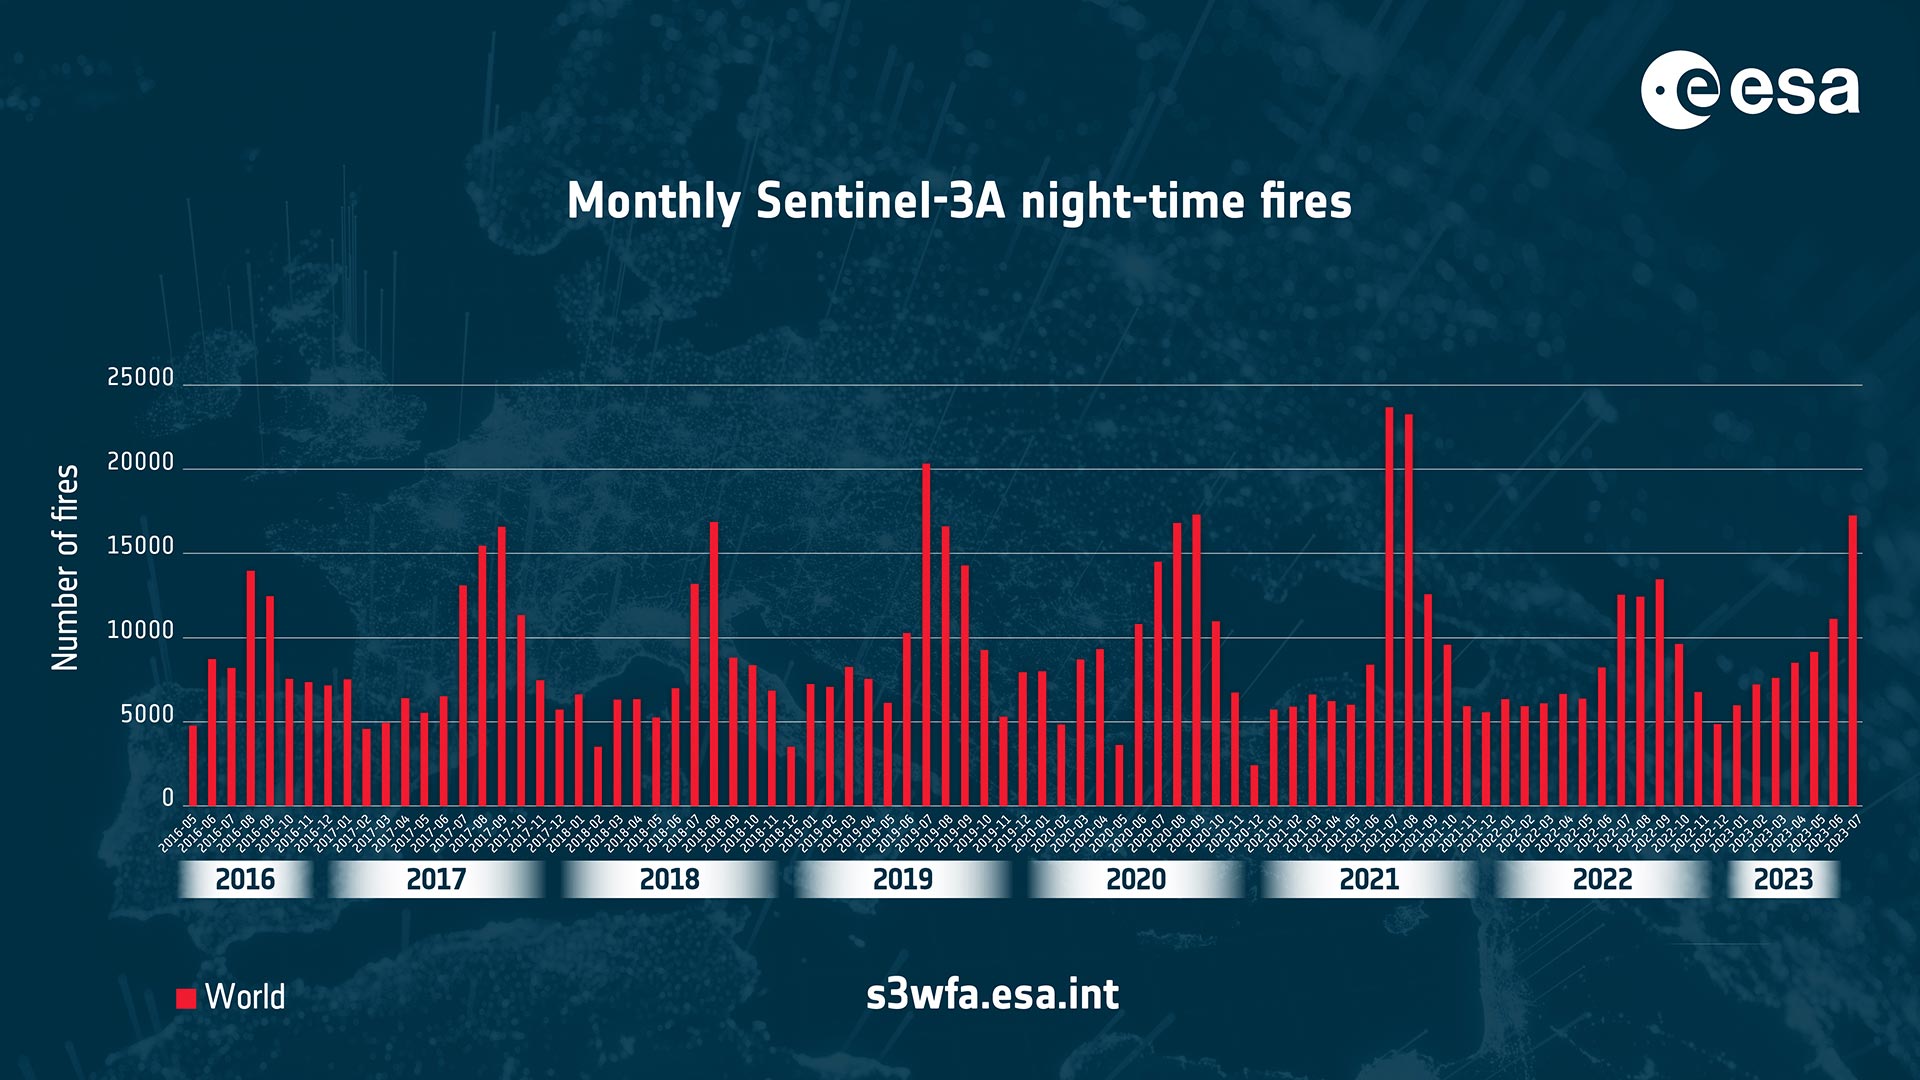
In light of the severe wildfires, ESA has reopened its World Fire Atlas which offers an insight into the distribution of individual fires taking place at both a national and global scale.
Through its interactive dashboard, users can compare the frequency of fires between countries as well as analyze the evolution of fires taking place over time. The atlas originally opened in 2019, where it supported both European civil protection agencies and firefighters.
The dashboard uses night-time data from the Sea and Land Surface Temperature Radiometer (SLSTR) on board the Copernicus Sentinel-3A satellite. Working like a thermometer in the sky, the sensor measures thermal infrared radiation to take the temperature of Earth’s land surfaces which is used to detect the fires.
Even if the atlas cannot pick up all fires because of satellite overpass constraints and cloud coverage, it is statistically representative from one month to the other and from one year to the other. Data from the Copernicus Sentinel-3B satellite will be added in December 2023.
Historical Data and Canadian Wildfires
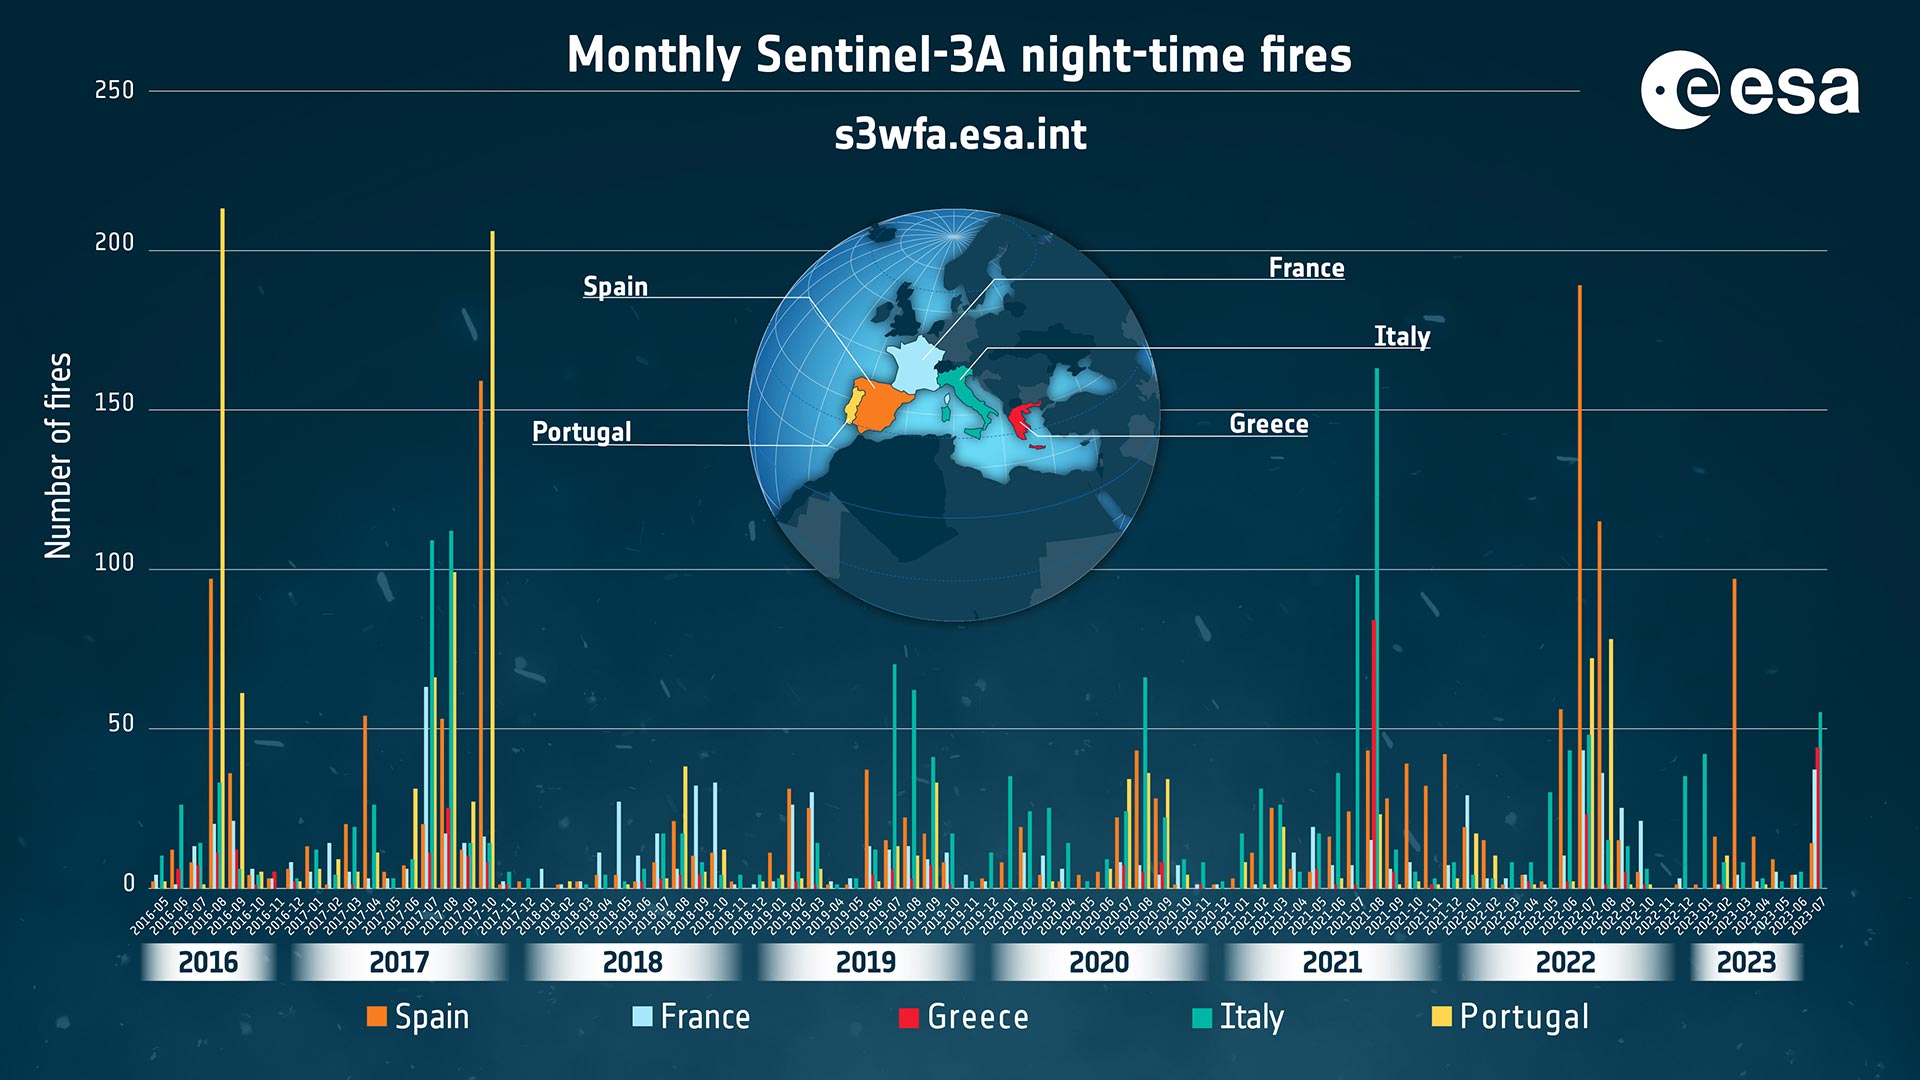
Over the previous seven years, data from the World Fire Atlas show a substantial number of fires detected in Portugal, Italy, Greece, France and Spain with the highest number of fires reached in Portugal in August 2016 and October 2017.
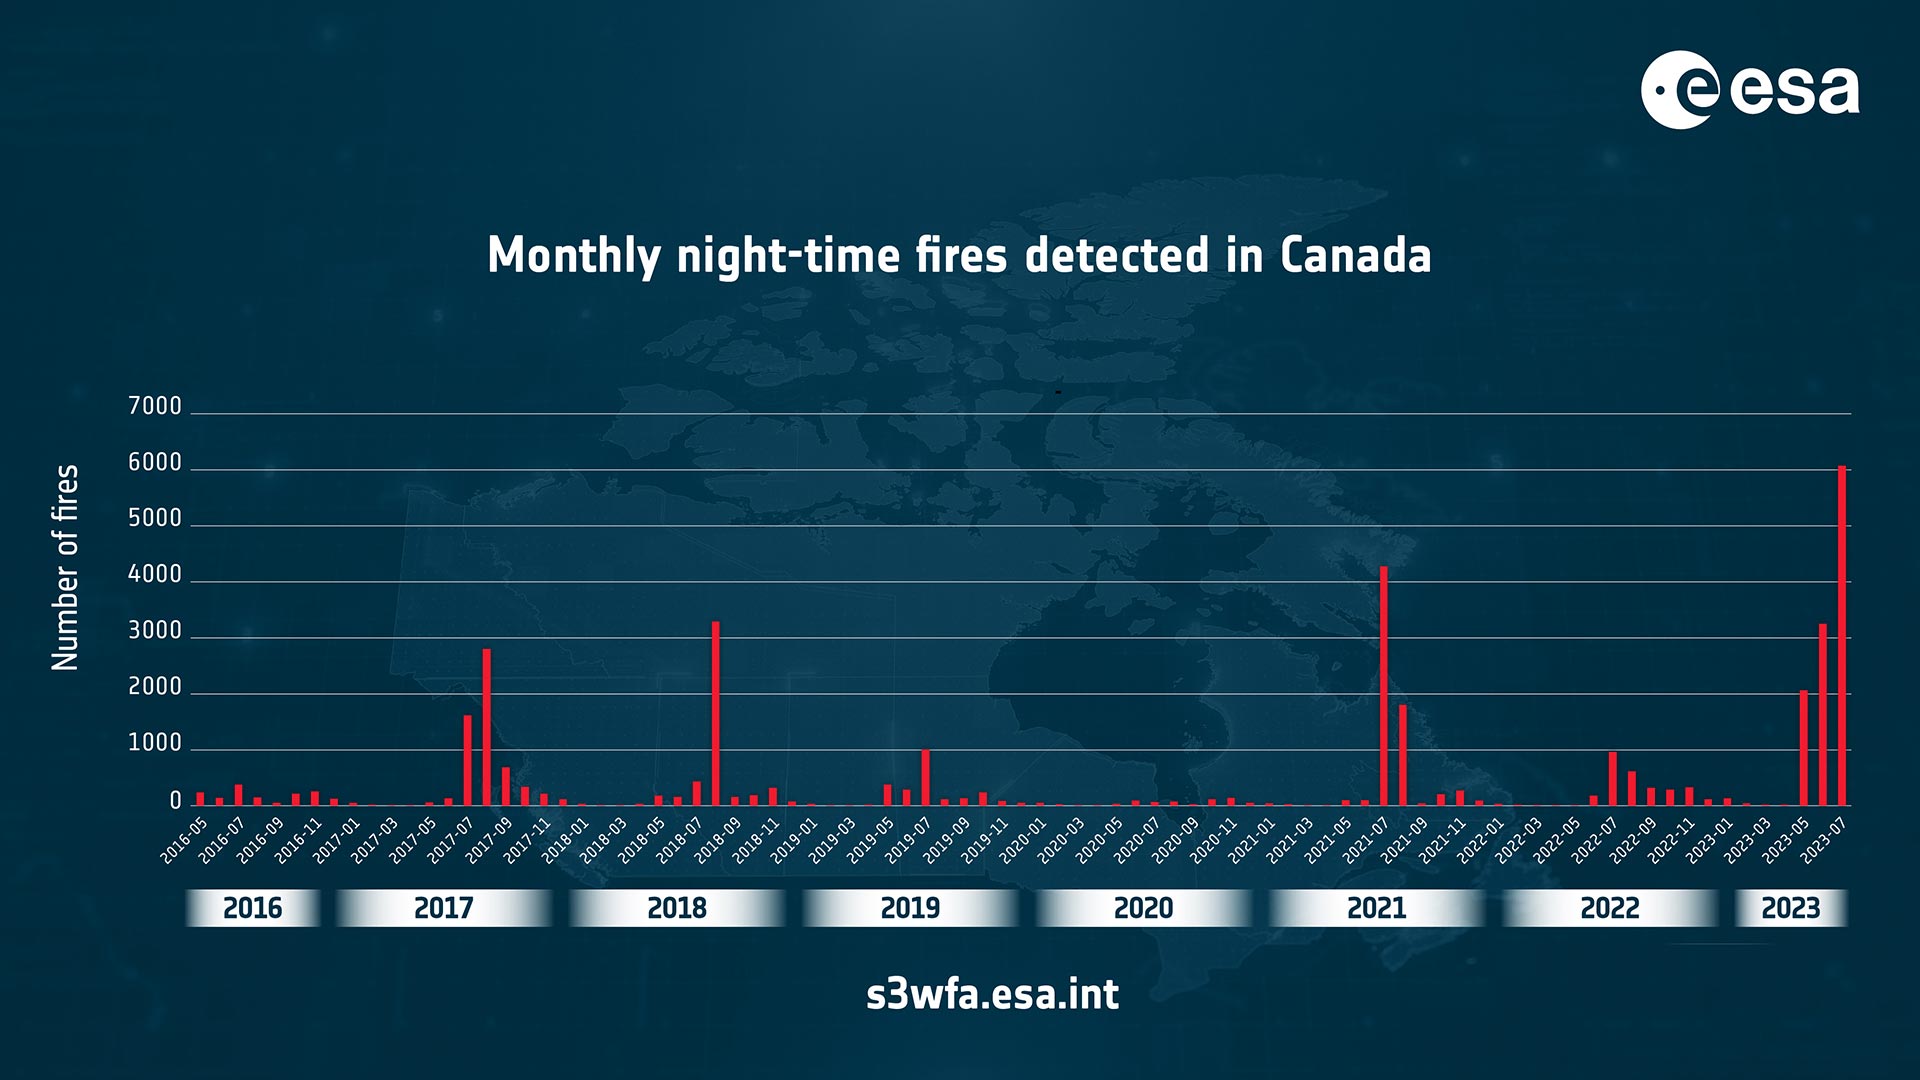
Data, which is in terms of ‘pixels’, show that there were 11 598 fire pixels in Canada during the first seven months of 2023. This is a 705% increase compared to the average number of fire pixels detected over the same period (from January 1 to July 31) of the previous six years (from 2017 to 2022).
Canada is currently battling the country’s worst wildfire season on record, with more than 10 million hectares of land burned, which is said to increase in the coming weeks.
Conclusion: ESA’s Commitment
ESA’s Olivier Arino said, “The relaunch of the World Fire Atlas presents a valuable opportunity for authorities, researchers, and organizations to enhance their understanding of fire occurrences worldwide. By utilizing this comprehensive resource, they can devise more effective strategies for fire prevention and management on a global scale.
“The ongoing commitment of ESA, Copernicus, and the EU to continuously provide this valuable resource reinforces the importance of leveraging space technology to address critical environmental challenges.”
Never miss a breakthrough: Join the SciTechDaily newsletter.
Follow us on Google and Google News.