In 2022, Earth Was About 1.11°C (2°F) Warmer Than the Late 19th Century Average
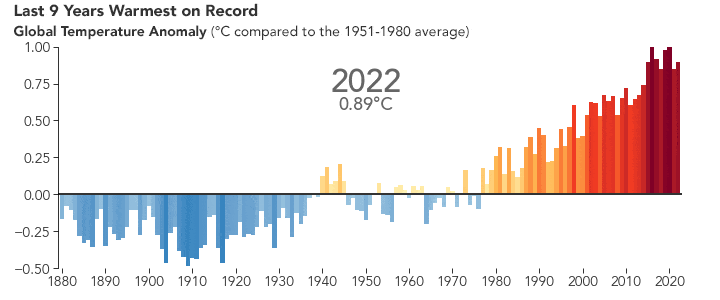
Earth’s average surface temperature in 2022 tied with 2015 as the fifth warmest on record, according to an analysis by NASA. Continuing the planet’s long-term warming trend, global temperatures in 2022 were 0.89 degrees Celsius (1.6 degrees Fahrenheit) above the average for NASA’s baseline period (1951–1980), according to scientists at NASA’s Goddard Institute for Space Studies (GISS).
The past nine years have been the warmest years since modern recordkeeping began in 1880. This means Earth in 2022 was about 1.11°C (2°F) warmer than the late 19th century average.
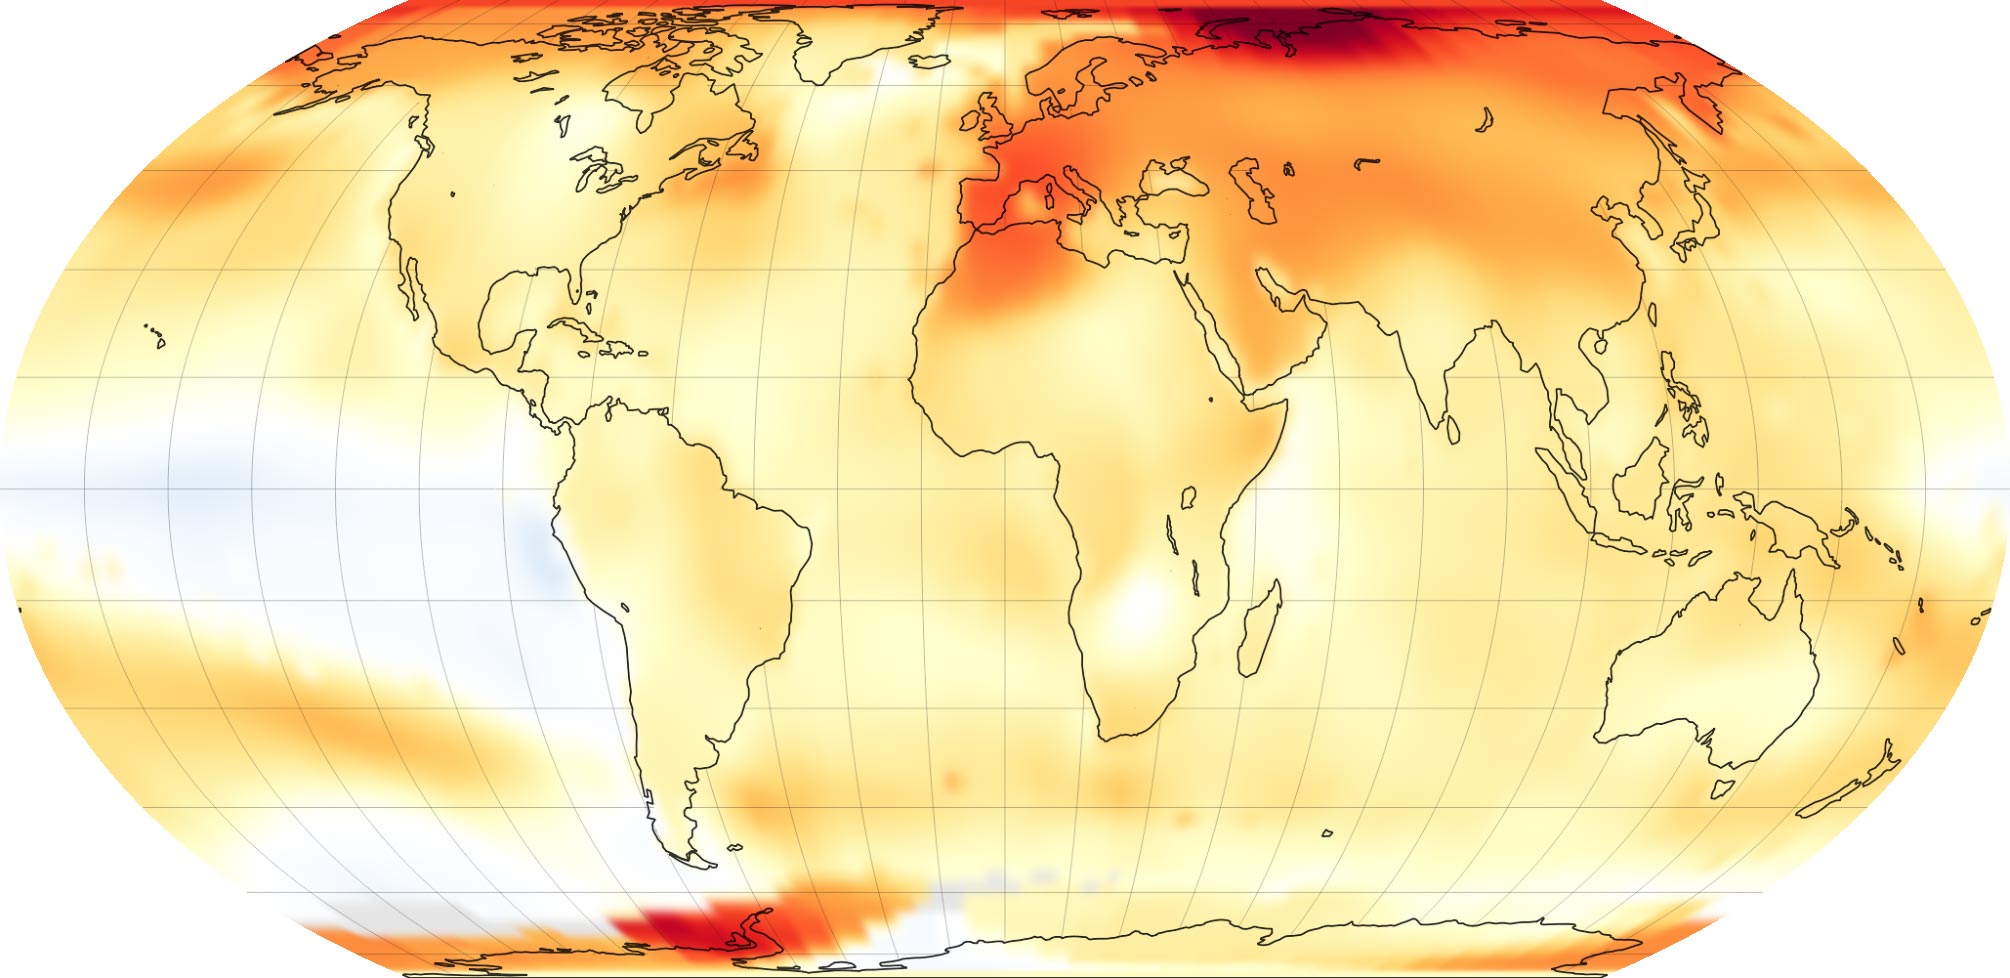
The map above depicts global temperature anomalies in 2022. It does not show absolute temperatures; instead, it shows how much warmer or cooler each region of Earth was compared to the average from 1951 to 1980. The bar chart below shows 2022 in context with temperature anomalies since 1880. The values represent surface temperatures averaged over the entire globe for the year.
Human Activities Driving Climate Change
“The reason for the warming trend is that human activities continue to pump enormous amounts of greenhouse gases into the atmosphere, and the long-term planetary impacts will also continue,” said Gavin Schmidt, director of GISS, NASA’s leading center for climate modeling.
Human-driven greenhouse gas emissions have rebounded following a short-lived dip in 2020 due to the COVID-19 pandemic. Recently, NASA scientists, as well as international scientists, determined carbon dioxide emissions were the highest on record in 2022. NASA also identified some super-emitters of methane—another powerful greenhouse gas—using the Earth Surface Mineral Dust Source Investigation (EMIT) instrument that launched to the International Space Station last year.
Arctic Warming and Global Impacts
The Arctic region continues to experience the strongest warming trends—close to four times the global average—according to GISS research presented at the 2022 annual meeting of the American Geophysical Union, as well as a separate study.
Communities around the world are experiencing impacts scientists see as connected to the warming atmosphere and ocean. Climate change has intensified rainfall and tropical storms, deepened the severity of droughts, and increased the impact of storm surges. Last year brought torrential monsoon rains that devastated Pakistan and a persistent megadrought in the U.S. Southwest. In September, Hurricane Ian became one of the strongest and costliest hurricanes to strike the continental U.S.
2022 effectively tied for Earth’s 5th warmest year since 1880, and the last 9 consecutive years have been the warmest 9 on record. NASA looks back at how heat was expressed in different ways around the world in 2022. Credit: NASA’s Goddard Space Flight Center
NASA’s global temperature analysis is drawn from data collected by weather stations and Antarctic research stations, as well as instruments mounted on ships and ocean buoys. NASA scientists analyze these measurements to account for uncertainties in the data and to maintain consistent methods for calculating global average surface temperature differences for every year. These ground-based measurements of surface temperature are consistent with satellite data collected since 2002 by the Atmospheric Infrared Sounder on NASA’s Aqua satellite and with other estimates.
NASA uses the period from 1951–1980 as a baseline to understand how global temperatures change over time. That baseline includes climate patterns such as La Niña and El Niño, as well as unusually hot or cold years due to other factors, ensuring it encompasses natural variations in Earth’s temperature.
The Influence of La Niña Conditions
Many factors can affect the average temperature in any given year. For example, 2022 was one of the warmest on record despite a third consecutive year of La Niña conditions in the tropical Pacific Ocean. NASA scientists estimate that La Niña’s cooling influence may have lowered global temperatures slightly (about 0.06°C or 0.11°F) from what the average would have been under more typical ocean conditions.
A separate, independent analysis by the National Oceanic and Atmospheric Administration (NOAA) concluded that the global surface temperature for 2022 was the sixth highest since 1880. NOAA scientists use much of the same raw temperature data in their analysis and have a different baseline period (1901–2000) and methodology. Although rankings for specific years can differ slightly between the records, they are in broad agreement and both reflect ongoing long-term warming.
NASA’s full dataset of global surface temperatures through 2022, as well as full details with code of how NASA scientists conducted the analysis, are publicly available from GISS.
NASA Earth Observatory images by Joshua Stevens, based on data from the NASA Goddard Institute for Space Studies.
Never miss a breakthrough: Join the SciTechDaily newsletter.
Follow us on Google and Google News.
3 Comments
There is a lot of misleading information in this press release.
2022 is tied for 5th/6th place because, unlike the consistent increase in CO2, there has been no statistically significant warming for over 8 years.
“The reason for the warming trend is that human activities continue to pump enormous amounts of greenhouse gases into the atmosphere, …”
Those “enormous” amounts are less than the uncertainty in the estimated ocean CO2 flux.
“Human-driven greenhouse gas emissions have rebounded following a short-lived dip in 2020 due to the COVID-19 pandemic.”
However, that dip in 2020 was NOT reflected in the atmospheric concentrations. The monthly measurements, showing seasonal changes, were indistinguishable from 2019 and 2021. The above quote is not incorrect. However, it implies more than it means and I believe was intended to convince readers of something that isn’t true. Namely, that human emissions are driving the warming.
If anthropogenic greenhouse gases are so important, why is there an isolated hot spot over the Antarctic archipelago? Why is Siberia showing so much warming when the anthropogenic CO2 sources are in the northern mid-latitudes?
I’m very tired of misleading claims, taken out of context, and claiming to prove things that aren’t true. I consider the behavior of these NASA scientists to be propagandistic and unscientific.
Just a reminder, the 19th Century was a part of the “Little Ice Age”. The excellent animation shows “Global Temperature Anomaly” at that time as half a degree then lower then median, although the Victorians may have had less ability to identify temperature anomalies worldwide than the infrared satellite. If you’re a degree higher since the little ice age, you’re alright for now.
“NASA’s global temperature analysis is drawn from data collected by weather stations and Antarctic research stations, as well as instruments mounted on ships and ocean buoys.”