Decades of gradual warming due to human-caused climate change and an El Niño in the Pacific Ocean nudged global ocean temperatures to record levels in 2023.
In March and April 2023, some earth scientists began to point out that average sea surface temperatures had surpassed the highest levels seen in a key data record maintained by NOAA. Months later, they remain at record levels, with global sea surface temperatures 0.99°C (1.78°F) above average in July. That was the fourth consecutive month they were at record levels.
Factors Driving the Rise
Scientists from NASA have taken a closer look at why. “There are a lot of things that affect the world’s sea surface temperatures, but two main factors have pushed them to record heights,” said Josh Willis, an oceanographer at NASA’s Jet Propulsion Laboratory (JPL). “We have an El Niño developing in the Pacific, and that’s on top of long-term global warming that has been pushing ocean temperatures steadily upward almost everywhere for a century.”
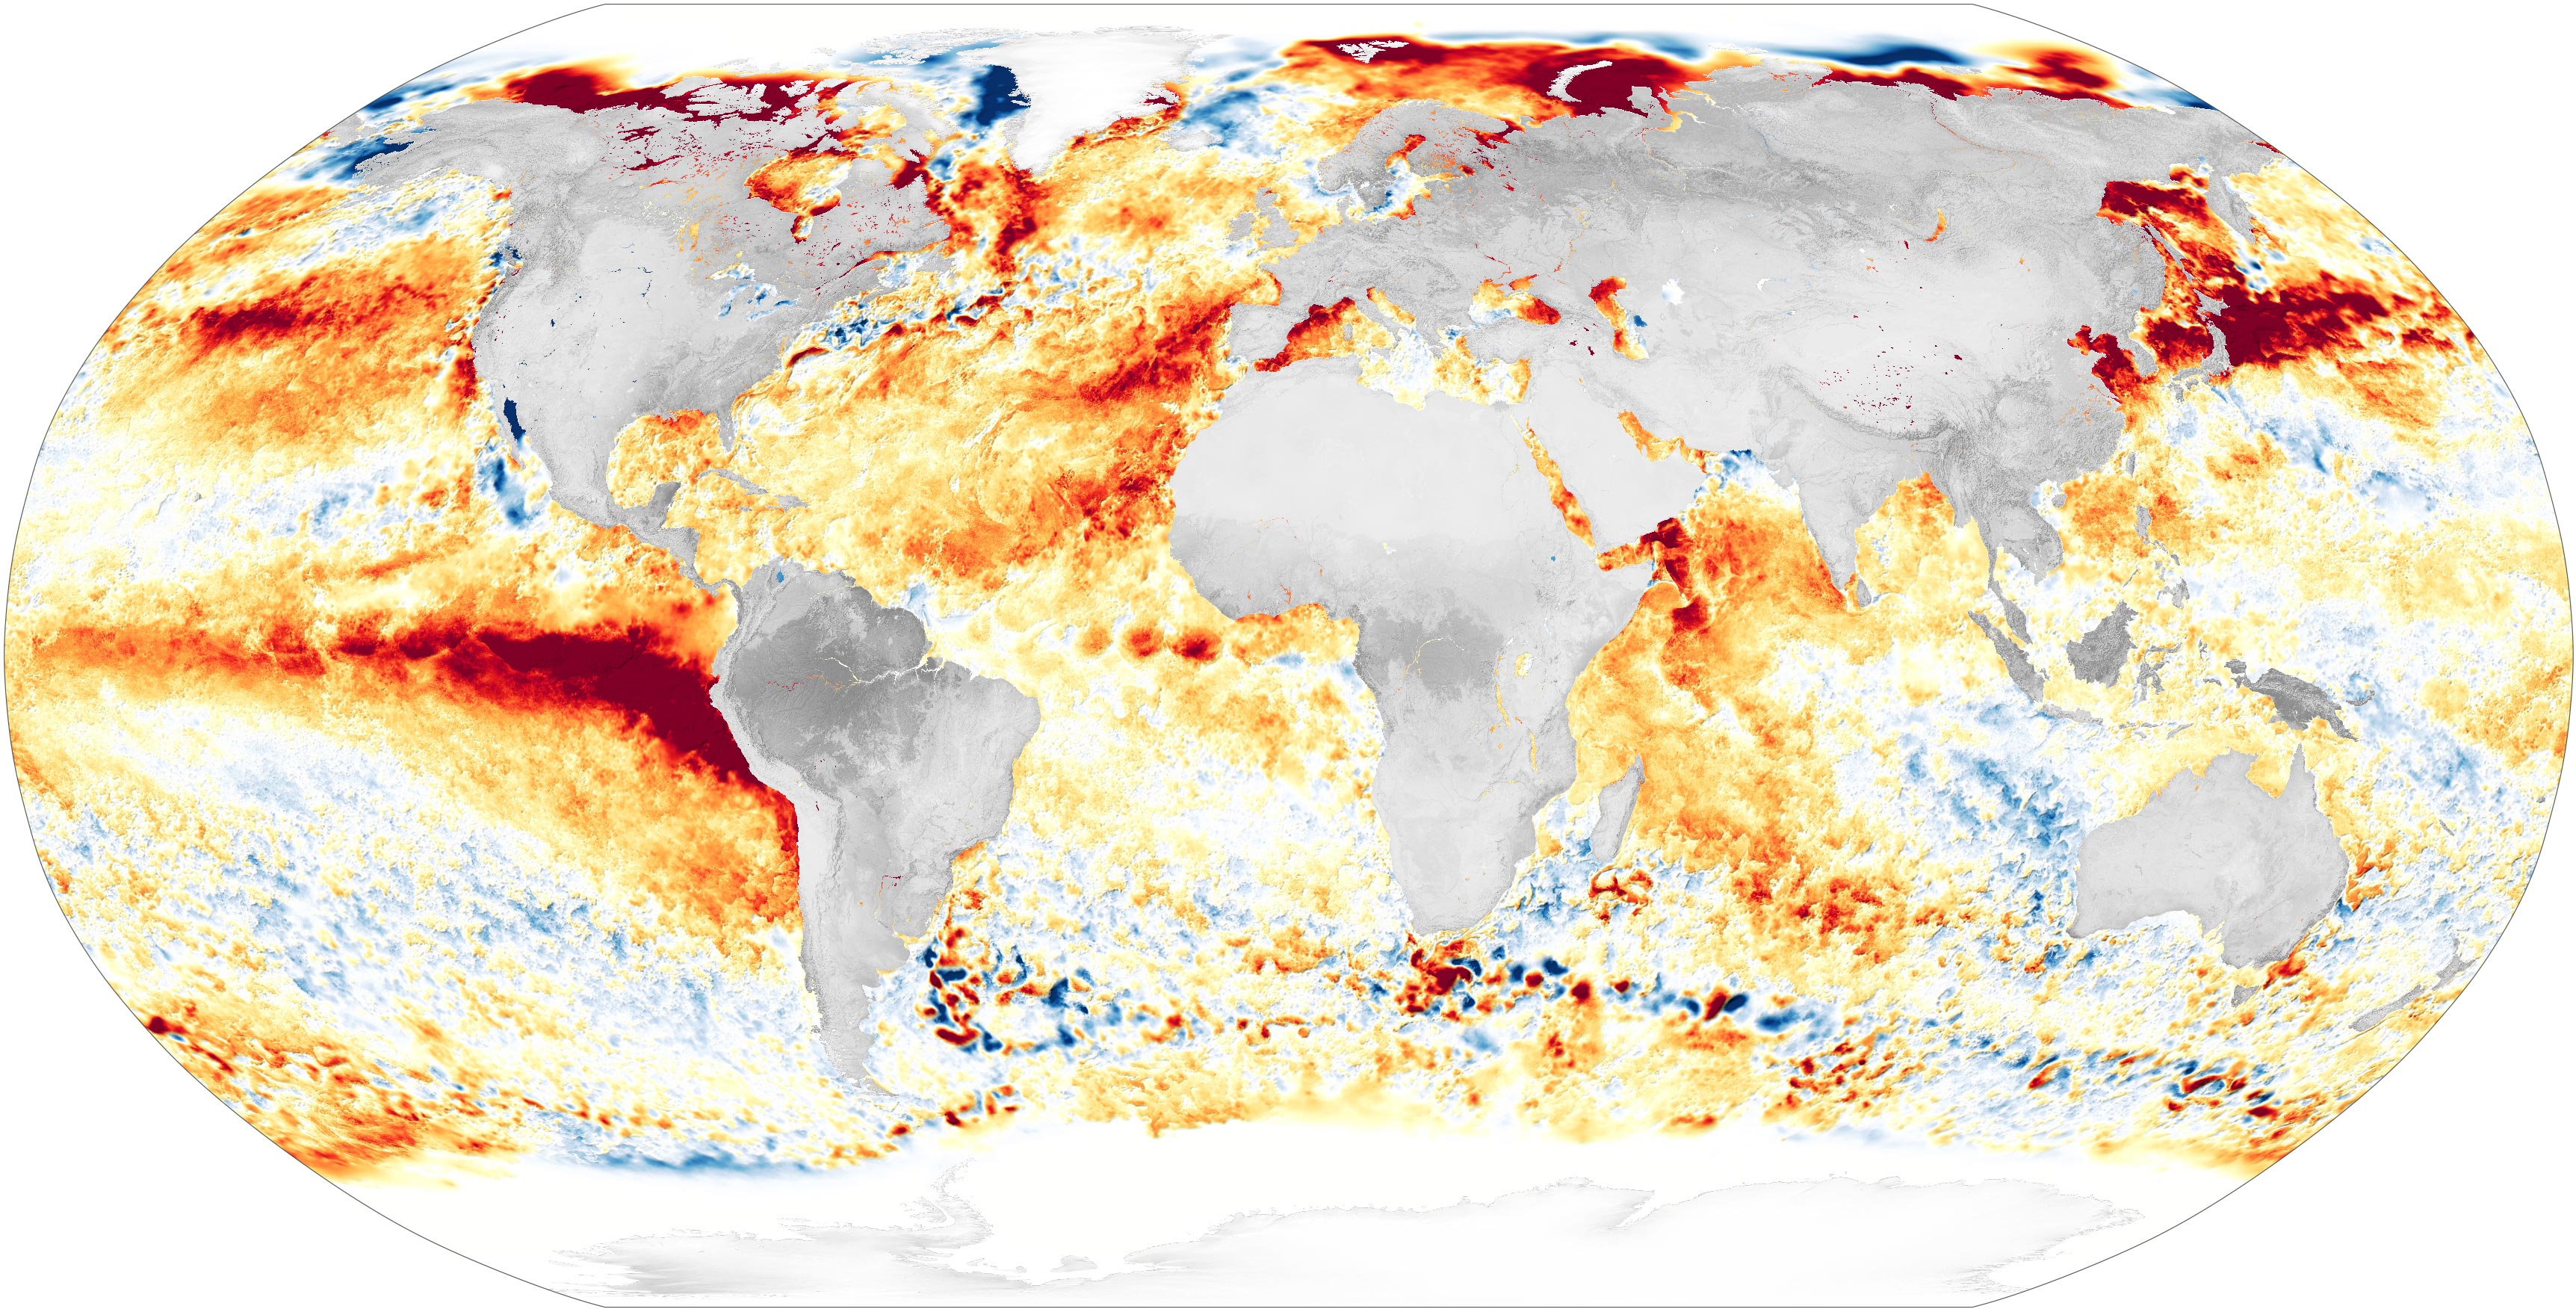
The map at the top of this article shows sea surface temperature anomalies on August 21, 2023, when many areas were more than 3°C (5.4°F) warmer than normal. On that date, much of the central and eastern regions of the equatorial Pacific were unusually warm, the signature of a developing El Niño. As has been the case for weeks, large patches of warm water were also present in the Northwest Pacific near Japan and the Northeast Pacific near California and Oregon. Portions of the Indian, Southern, and Arctic Oceans also showed unusual warmth.
Data and Anomalies
The map is based on data from the Multiscale Ultrahigh Resolution Sea Surface Temperature (MUR SST) project, a JPL effort that blends measurements of sea surface temperatures from multiple NASA, NOAA, and international satellites, as well as ship and buoy observations. Rather than showing absolute temperature, the anomaly reflects the difference between the sea surface temperature on August 21, 2023, and the 2003-2014 average for that day. The video below, also based on MUR SST data, shows global sea surface temperatures since April 1, 2023, the period when they have been at record-breaking levels. The warmest waters appear dark red.
Based on MUR SST data, this video shows global sea surface temperatures between April 1 and August 21, 2023, the period when they have been at record-breaking levels. The warmest waters appear dark red.
“Over the long term, we’re seeing more heat and warmer sea surface temperatures pretty much everywhere,” said Gavin Schmidt, the director of NASA’s Goddard Institute for Space Studies. “That long-term trend is almost entirely attributable to human forcing—the fact that we’ve put such a huge amount of greenhouse gas in the atmosphere since the start of the industrial era.”
Decoding the Trends
Schmidt noted that other factors—such as weather and wind patterns or the distribution of dust and aerosols—have short-term effects on sea surface temperatures in certain regions, but they generally have a minor effect on the longer-term global mean. Previous research shows that as much as 90 percent of the excess heat that has occurred in recent decades due to increasing greenhouse gas emissions is absorbed by the ocean, with much of that heat stored near the surface.
The most important factor that helped push sea surface temperatures into record territory in 2023 was the evolving El Niño in the Pacific, according to Willis. He came to that conclusion by analyzing the timing and intensity of sea surface temperature anomalies in several regions and comparing them to the global trend.
“We had a big jump in global surface temperature at the beginning of April—exactly when the Pacific temperatures jumped up and also when sea levels in the eastern Pacific started to rise,” Willis said. “The heat waves in the Atlantic are important and will have serious effects on marine life and weather in Europe in the coming months. But it’s the Pacific that has taken the global mean on a wild ride this year.”
What happens in the Pacific tends to have a large influence on the global sea surface temperatures partly because of its size. The Pacific represents about half of the world’s ocean area.
Marine Heat Waves
Marine heat waves—defined as periods of persistent anomalously warm ocean temperatures (warmer than 90 percent of the previous observations for a given time of year)—have occurred recently in several areas. One NOAA analysis showed that 48 percent of the global oceans were in the midst of a marine heat wave in August—a larger area than for any other month since the start of the record in 1991. Particularly intense events have warmed the North Atlantic and parts of the Caribbean in recent months.
Willis expects the heat in the equatorial Pacific to have more staying power than many of the other marine heat waves simmering around the world. “Many of the marine heat waves we’re seeing are ephemeral and ‘skin’ deep, generally lasting on the order of weeks and driven by atmospheric forces,” explained Willis.
The unusually warm water in the equatorial Pacific associated with the developing El Niño after three consecutive years of La Niña is expected to weaken trade winds in ways that reinforce and amplify the warming of surface waters, fueling the El Niño further. Forecasters from NOAA say that there is a greater than 95 percent chance that El Niño conditions will persist throughout the Northern Hemisphere winter. “What’s happening in the Pacific with El Niño will influence global weather patterns and sea surface temperatures well into the winter and possibly even longer,” Willis said.
Monitoring Tools and Conclusion
To monitor sea surface temperatures, scientists at NOAA and NASA analyze observations from sensors and buoys in the oceans, ships, and several different polar-orbiting and geostationary satellites. Groups of scientists with NOAA’s Physical Sciences Laboratory, NOAA’s Coral Reef Watch, and NASA’s Jet Propulsion Laboratory track marine heat waves and sea surface temperature anomalies closely. You can use NASA’s State of the Ocean Tool on Worldview to monitor daily sea surface temperature anomalies.
NASA Earth Observatory image by Lauren Dauphin, using data from the Multiscale Ultrahigh Resolution (MUR) project. Video by NASA’s Scientific Visualization studio, using data from the MUR project.
Never miss a breakthrough: Join the SciTechDaily newsletter.
Follow us on Google and Google News.
3 Comments
NASA is multiplying entities. “Decades of gradual warming due to human-caused climate change and an El Niño in the Pacific Ocean nudged global ocean temperatures to record”, Occam’s razor, pick one. The “Multiscale Ultrahigh Resolution Sea Surface Temperature (MUR SST)” actually prefers to self-identify as the NASA MEaSUREs-MUR SST (UVwXY & Z), and its dataset runs from 2002 to the present. That means it is only observing its 7th El Niño, only one of which (2014-16) was considered to be especially strong. A record-breaking recording in only a 21-year dataset is not unsurprising; Blu-Ray and iPods are older than this dataset. Still, I’m pleasantly surprised there’s no Earth-on-fire cartoon with this article.
Water has many unusual characteristics compared to other substances. Of note with respect to this article, it takes about 4-times as much energy to increase a given weight of water 1 deg C, compared to air; the ratio is even larger for most surficial materials like rocks. Be-that-as-it-may, historically, the reported air temperatures over land have been increasing about twice as fast as in the oceans. It is generally accepted that the average global temperature of the oceans and air over land combined (comparing apples with avocados), has increased about 1 deg C over the last century. Why are we seeing anomalies of up to 3 deg C in some places in the oceans, over the last two decades, particularly since the last 8 years has seen no statistically significant warming in the troposphere?
Two possibilities come to mind: 1) the method of combining the satellite and ship observations is flawed; 2) there is transient submarine heating from volcanoes and spreading centers.
https://scitechdaily.com/energy-unleashed-by-volcanic-eruptions-deep-in-our-oceans-could-power-all-of-the-united-states/
Note that this estimate by Leeds may be an underestimate because recent mapping of seamounts has nearly doubled recently.
https://www.techspot.com/news/98545-satellite-data-used-unveil-thousands-unknown-underwater-mountains.html