The 3D maps may help researchers track and predict the ocean’s response to climate change.
Life is teeming nearly everywhere in the oceans, except in certain pockets where oxygen naturally plummets and waters become unlivable for most aerobic organisms. These desolate pools are “oxygen-deficient zones,” or ODZs. And though they make up less than 1 percent of the ocean’s total volume, they are a significant source of nitrous oxide, a potent greenhouse gas. Their boundaries can also limit the extent of fisheries and marine ecosystems.
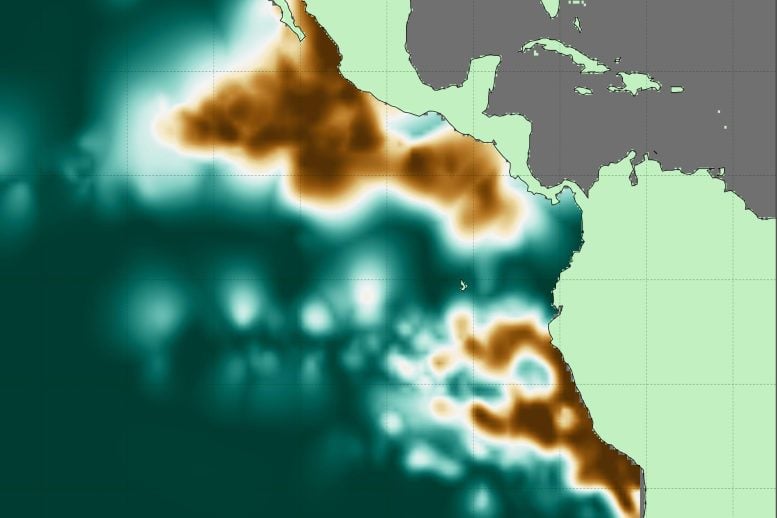
Now MIT scientists have generated the most detailed, three-dimensional “atlas” of the largest ODZs in the world. The new atlas provides high-resolution maps of the two major, oxygen-starved bodies of water in the tropical Pacific. These maps reveal the volume, extent, and varying depths of each ODZ, along with fine-scale features, such as ribbons of oxygenated water that intrude into otherwise depleted zones.
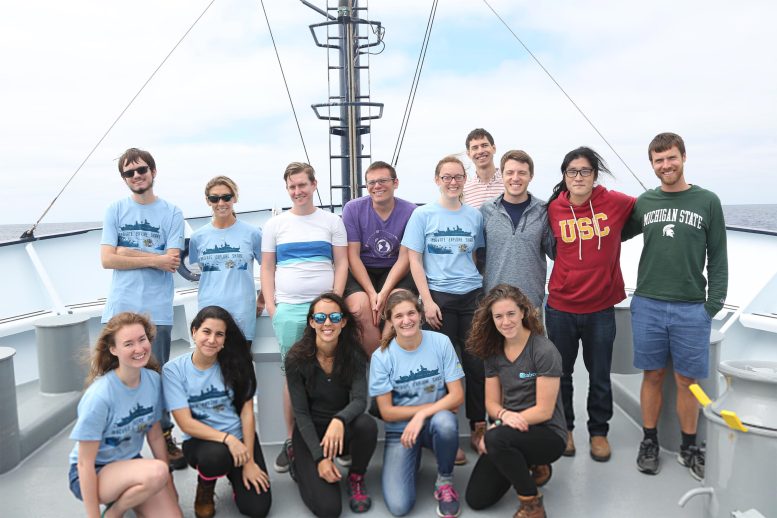
The team used a new method to process over 40 years’ worth of ocean data, comprising nearly 15 million measurements taken by many research cruises and autonomous robots deployed across the tropical Pacific. The researchers compiled then analyzed this vast and fine-grained data to generate maps of oxygen-deficient zones at various depths, similar to the many slices of a three-dimensional scan.
From these maps, the researchers estimated the total volume of the two major ODZs in the tropical Pacific, more precisely than previous efforts. The first zone, which stretches out from the coast of South America, measures about 600,000 cubic kilometers (144,000 cubic miles) — roughly the volume of water that would fill 240 billion Olympic-sized pools. The second zone, off the coast of Central America, is roughly three times larger.
The atlas serves as a reference for where ODZs lie today. The team hopes scientists can add to this atlas with continued measurements, to better track changes in these zones and predict how they may shift as the climate warms.
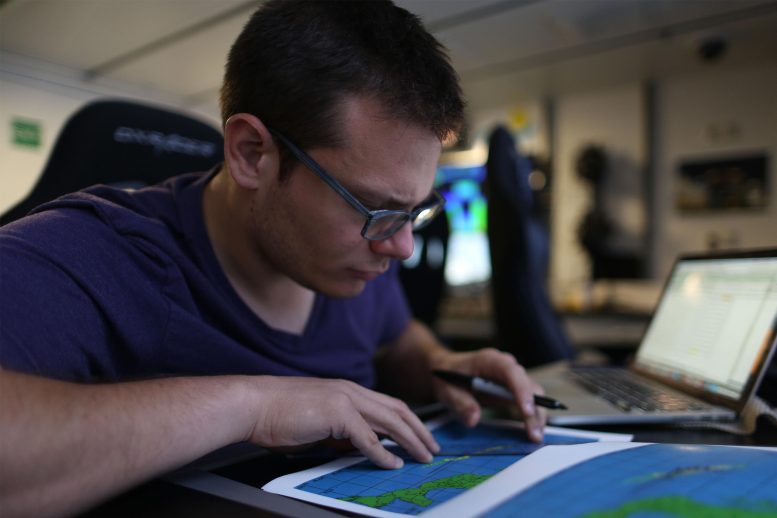
“It’s broadly expected that the oceans will lose oxygen as the climate gets warmer. But the situation is more complicated in the tropics where there are large oxygen-deficient zones,” says Jarek Kwiecinski ’21, who developed the atlas along with Andrew Babbin, the Cecil and Ida Green Career Development Professor in MIT’s Department of Earth, Atmospheric and Planetary Sciences. “It’s important to create a detailed map of these zones so we have a point of comparison for future change.”
The team’s study appears today (December 27, 2021) in the journal Global Biogeochemical Cycles.
Airing Out Artifacts
Oxygen-deficient zones are large, persistent regions of the ocean that occur naturally, as a consequence of marine microbes gobbling up sinking phytoplankton along with all the available oxygen in the surroundings. These zones happen to lie in regions that miss passing ocean currents, which would normally replenish regions with oxygenated water. As a result, ODZs are locations of relatively permanent, oxygen-depleted waters, and can exist at mid-ocean depths of between roughly 35 to 1,000 meters (115 to 3,300 feet) below the surface. For some perspective, the oceans on average run about 4,000 meters (13,000 feet) deep.
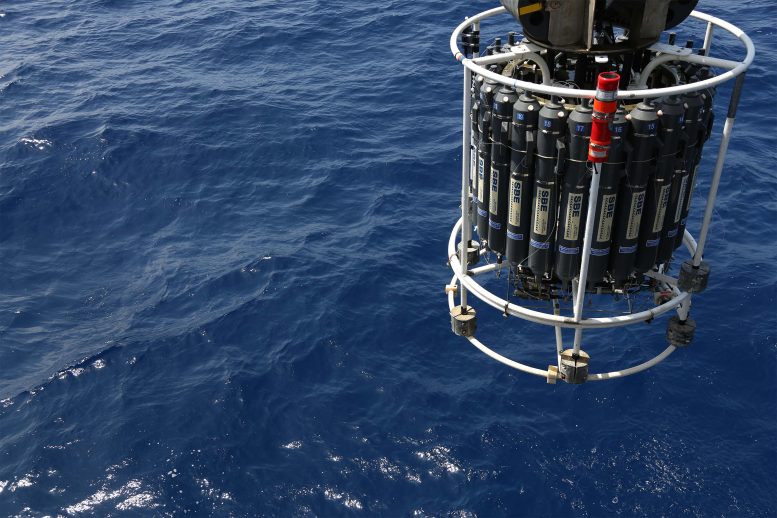
Over the last 40 years, research cruises have explored these regions by dropping bottles down to various depths and hauling up seawater that scientists then measure for oxygen.
“But there are a lot of artifacts that come from a bottle measurement when you’re trying to measure truly zero oxygen,” Babbin says. “All the plastic that we deploy at depth is full of oxygen that can leach out into the sample. When all is said and done, that artificial oxygen inflates the ocean’s true value.”
Rather than rely on measurements from bottle samples, the team looked at data from sensors attached to the outside of the bottles or integrated with robotic platforms that can change their buoyancy to measure water at different depths. These sensors measure a variety of signals, including changes in electrical currents or the intensity of light emitted by a photosensitive dye to estimate the amount of oxygen dissolved in water. In contrast to seawater samples that represent a single discrete depth, the sensors record signals continuously as they descend through the water column.
Scientists have attempted to use these sensor data to estimate the true value of oxygen concentrations in ODZs, but have found it incredibly tricky to convert these signals accurately, particularly at concentrations approaching zero.
“We took a very different approach, using measurements not to look at their true value, but rather how that value changes within the water column,” Kwiecinski says. “That way we can identify anoxic waters, regardless of what a specific sensor says.”
Bottoming Out
The team reasoned that, if sensors showed a constant, unchanging value of oxygen in a continuous, vertical section of the ocean, regardless of the true value, then it would likely be a sign that oxygen had bottomed out, and that the section was part of an oxygen-deficient zone.
The researchers brought together nearly 15 million sensor measurements collected over 40 years by various research cruises and robotic floats, and mapped the regions where oxygen did not change with depth.
“We can now see how the distribution of anoxic water in the Pacific changes in three dimensions,” Babbin says.
The team mapped the boundaries, volume, and shape of two major ODZs in the tropical Pacific, one in the Northern Hemisphere, and the other in the Southern Hemisphere. They were also able to see fine details within each zone. For instance, oxygen-depleted waters are “thicker,” or more concentrated towards the middle, and appear to thin out toward the edges of each zone.
“We could also see gaps, where it looks like big bites were taken out of anoxic waters at shallow depths,” Babbin says. “There’s some mechanism bringing oxygen into this region, making it oxygenated compared to the water around it.”
Such observations of the tropical Pacific’s oxygen-deficient zones are more detailed than what’s been measured to date.
“How the borders of these ODZs are shaped, and how far they extend, could not be previously resolved,” Babbin says. “Now we have a better idea of how these two zones compare in terms of areal extent and depth.”
“This gives you a sketch of what could be happening,” Kwiecinski says. “There’s a lot more one can do with this data compilation to understand how the ocean’s oxygen supply is controlled.”
Reference: “A High-Resolution Atlas of the Eastern Tropical Pacific Oxygen Deficient Zones” by Jarek V. Kwiecinski and Andrew R. Babbin, 27 December 2021, Global Biogeochemical Cycles.
DOI: 10.1029/2021GB007001
This research is supported, in part, by the Simons Foundation.
Never miss a breakthrough: Join the SciTechDaily newsletter.
Follow us on Google and Google News.
3 Comments
“… roughly the volume of water that would fill 240 billion Olympic-sized pools.”
Other than being a ‘Big Number,’ that isn’t an example that anyone can really relate to! It would be better to cite the percentage of total ocean volume. However, doing that it might not be as scary as a Big Number because the volume of the oceans is a really, really Big Number — Like 1.5 x 10^18 cubic meters.
Climate change, yes. And what about the millions liter of sewage daily, that the Oceans must “dissolve”.
This planet is filthy.