Where will you be for the 2023 and 2024 solar eclipses in the United States?
NASA has released a new map that could help you decide.
Based on observations from several NASA missions, the map details the path of the Moon’s shadow as it crosses the contiguous U.S. during the annular solar eclipse on October 14, 2023, and total solar eclipse on April 8, 2024.
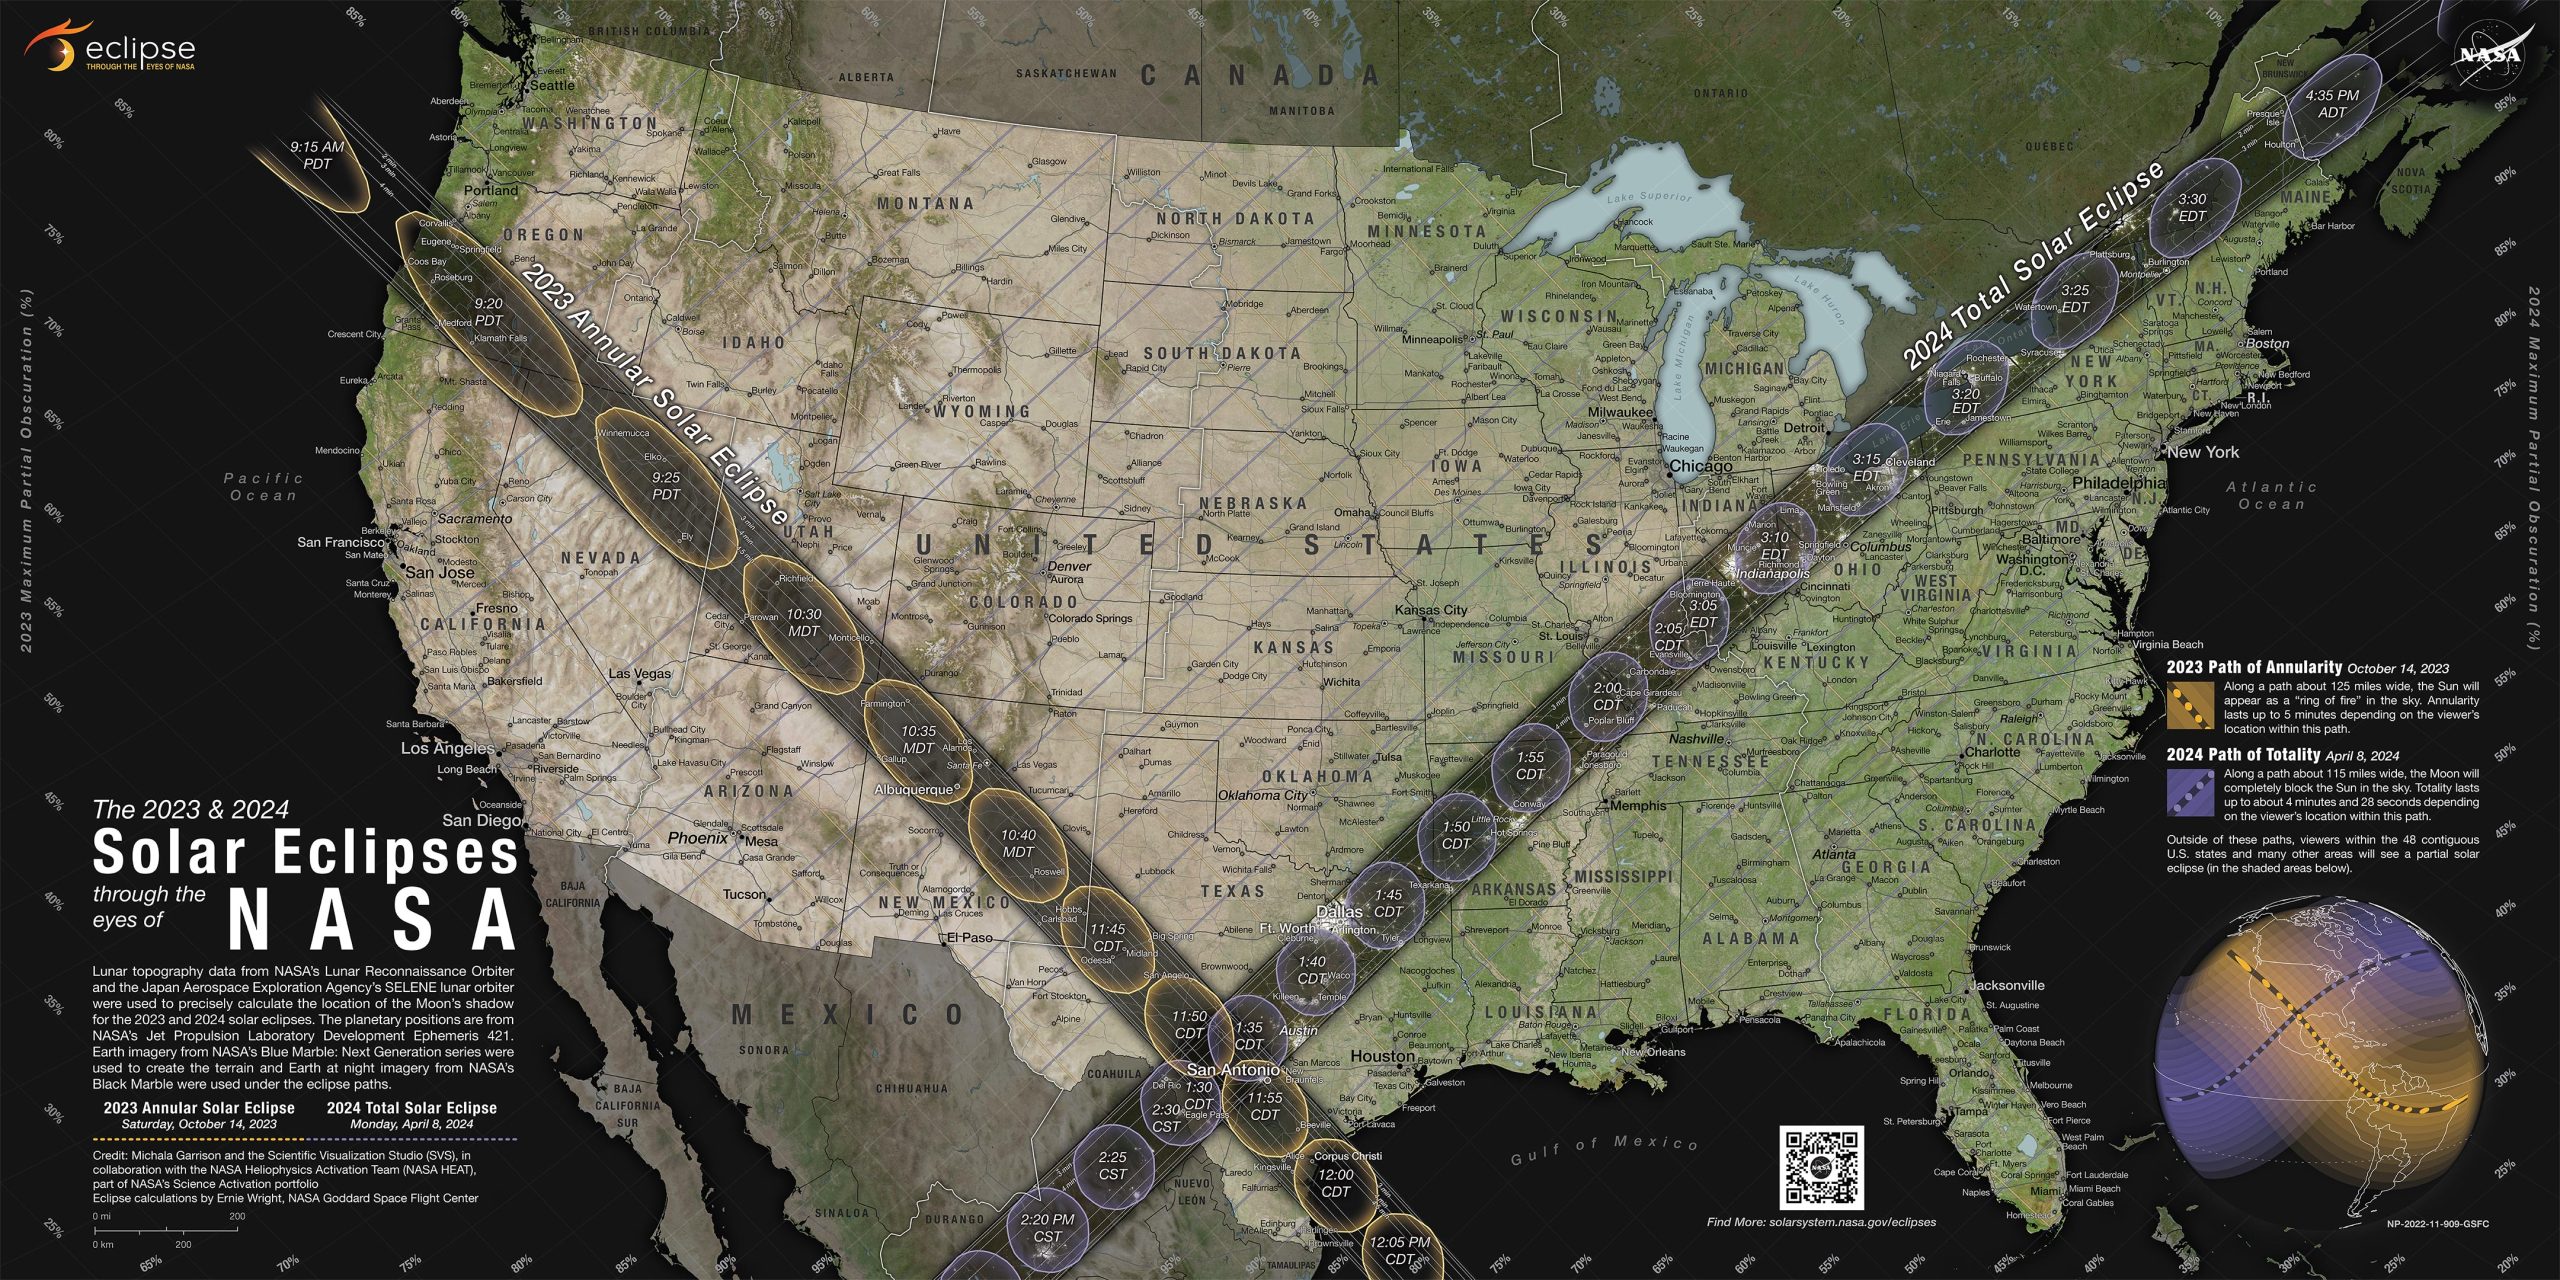
These dark paths across the continent show where observers will need to be to see the “ring of fire” when the Moon blocks all but the outer edge of the Sun during the annular eclipse, and the ghostly-white outer atmosphere of the Sun (the corona) when the Moon completely blocks the Sun’s disk during the total eclipse.
Outside those paths, the map also shows where and how much the Sun will be partially eclipsed by the Moon. On both dates, all 48 contiguous states in the U.S. will experience at least a partial solar eclipse (as will Mexico and most of Canada).
Reading the Map
On NASA’s new eclipse map, the paths for the annular eclipse and total eclipse appear as dark bands across the U.S.
Anyone located in the annular eclipse path, from Oregon to Texas, will have a chance to see the annular eclipse if the skies are clear. Anyone located in the total eclipse path, from Texas to Maine, will have a chance to see the total eclipse, weather permitting.
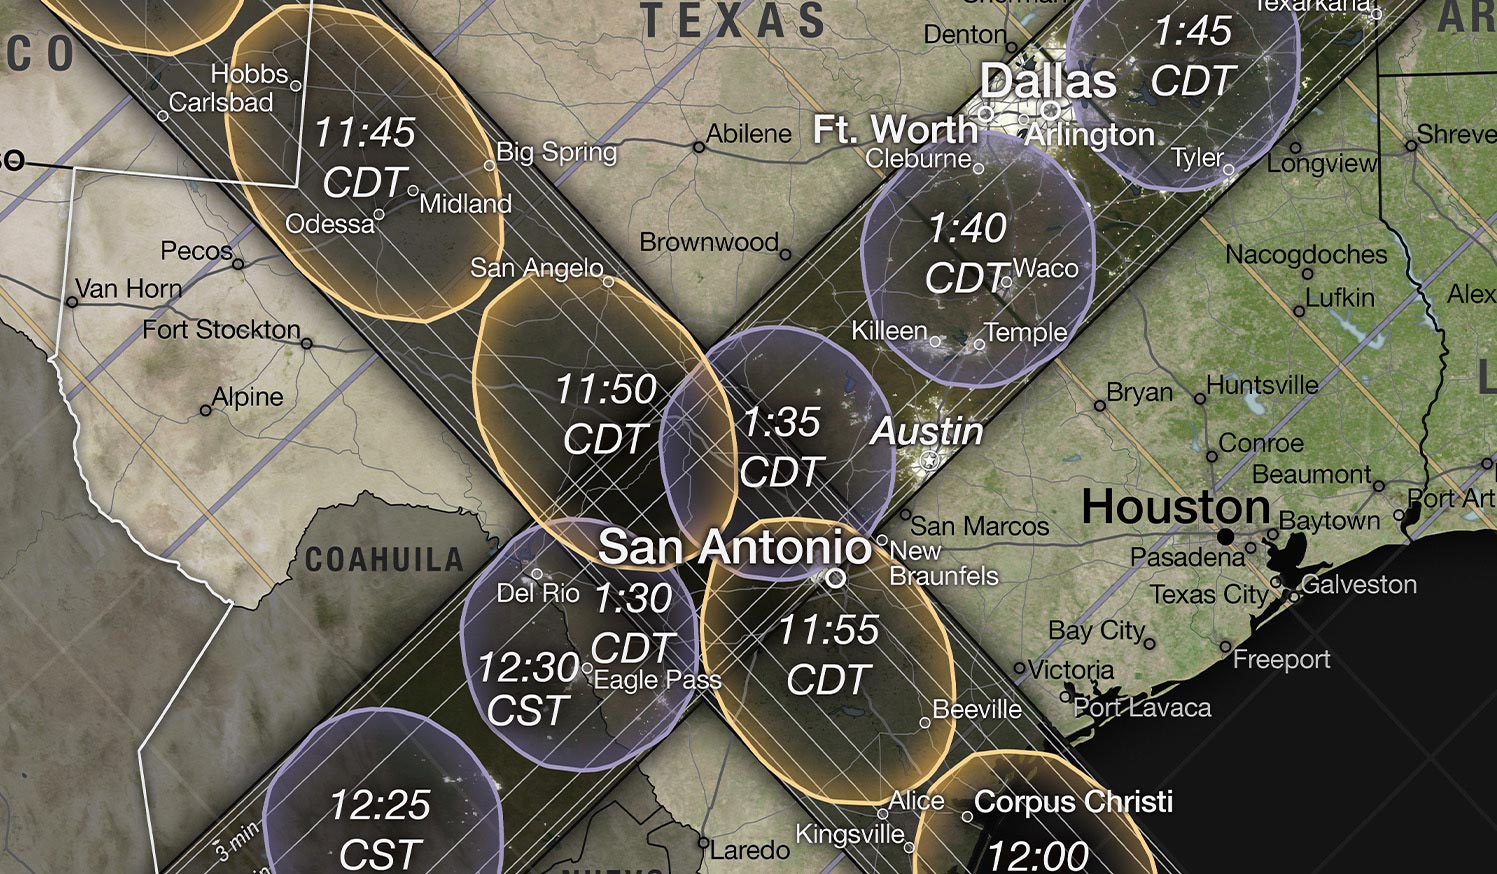
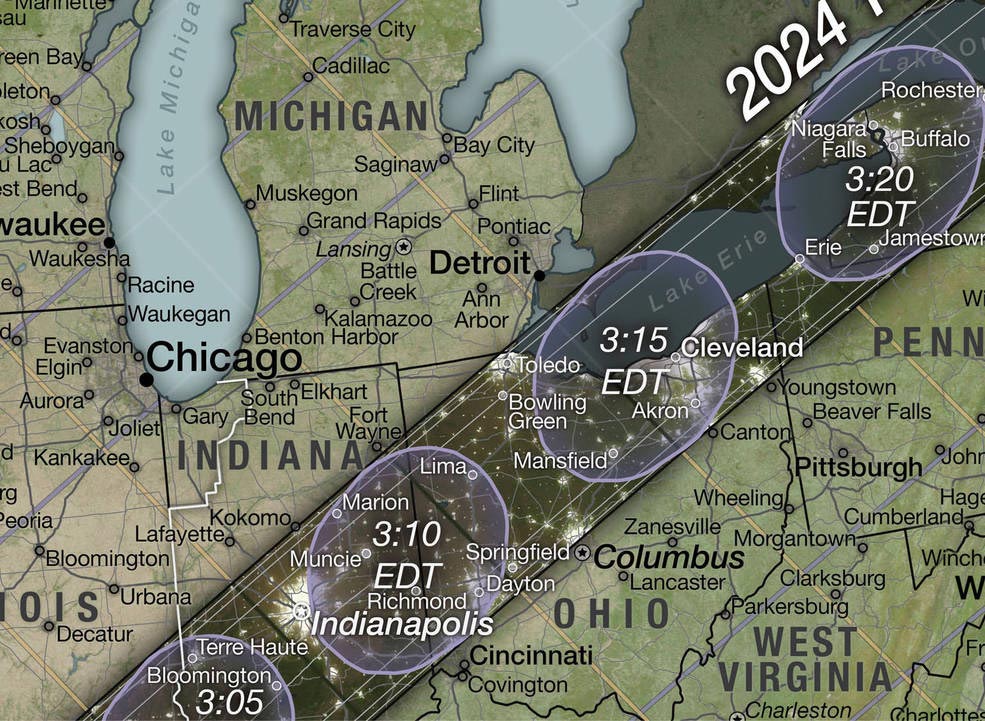
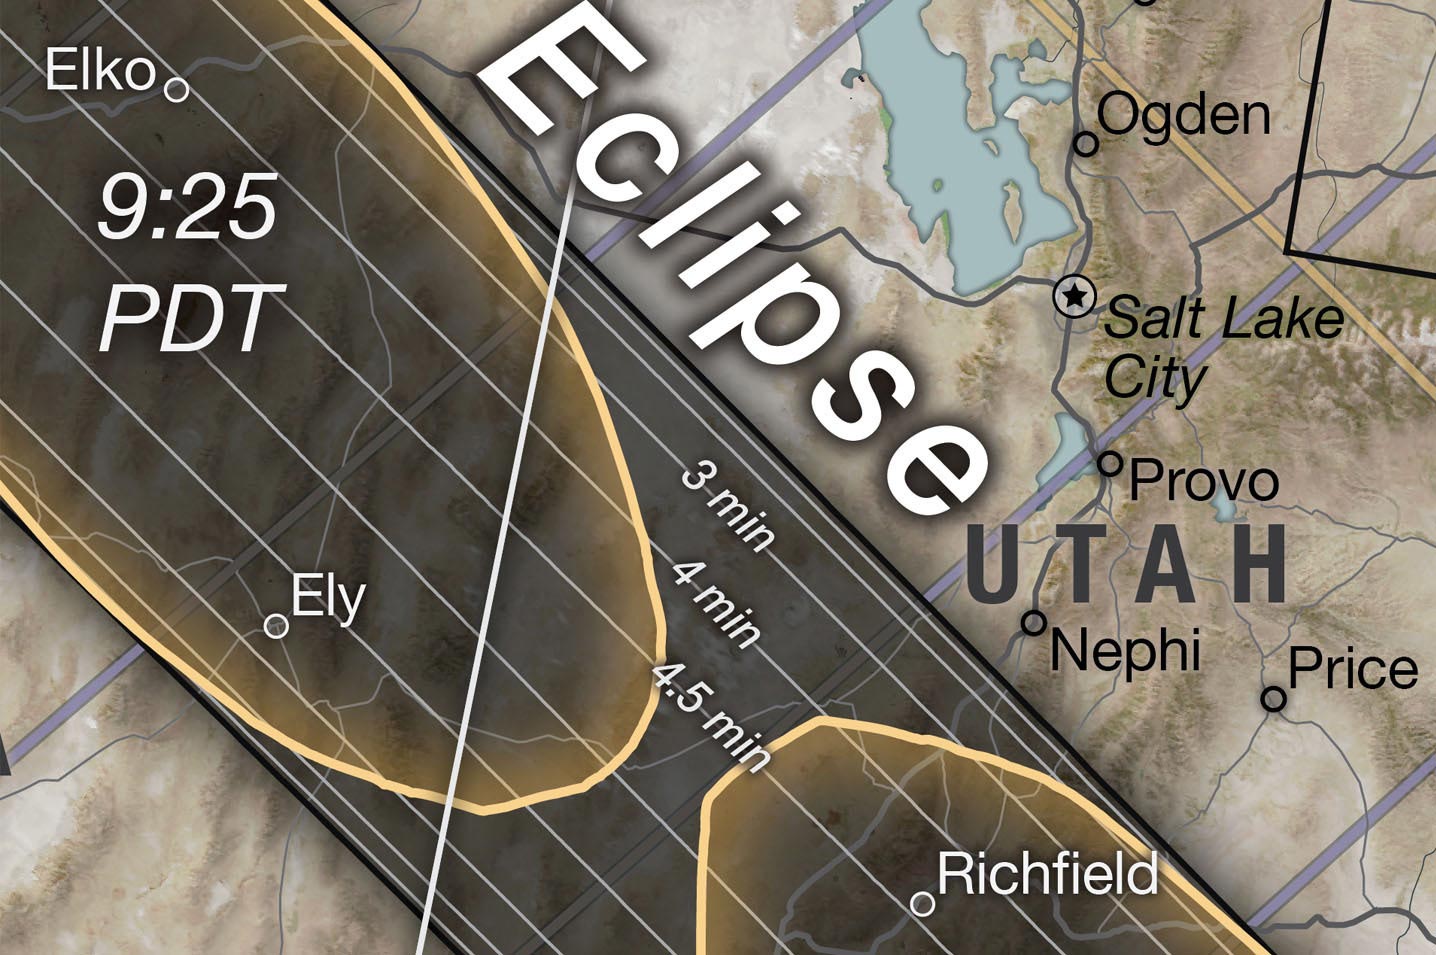
Inside those dark paths are oval shapes with times inside them (yellow ovals for the annular eclipse, purple ovals for the total eclipse). Those ovals show the shape of the Moon’s shadow cast on Earth’s surface at the times shown. People in the areas inside the ovals will see the annular eclipse or total eclipse at that time.
For locations close to the center of the paths, the annular eclipse or total eclipse will last longer than those near the outer edges of the path. Inside each path are white lines that indicate how long annularity or totality will last. For the annular eclipse path, you can find labels (ranging from 3 to 4.5 minutes) near the Nevada-Utah border in the north and between San Antonio and Corpus Christi, Texas, in the south. For the total eclipse path, you can find labels near Presque Isle, Maine, in the north, and between the 2:20 and 2:25 p.m. CST ovals in Mexico in the south.
Viewers in locations outside the paths will not experience a total solar eclipse or annular eclipse, but they may still see a partial eclipse. Lines running parallel to each path indicate how much of the Sun will become covered by the Moon during the partial eclipse. For the annular eclipse, these lines appear faint yellow. For the total eclipse, they’re faint purple. Percentage labels for the annular eclipse lines appear along the left and top edges of the map. The percentage labels for the total eclipse appear along the bottom and right edges of the map. (Tip: The percentages appear at the same angles as the lines.)

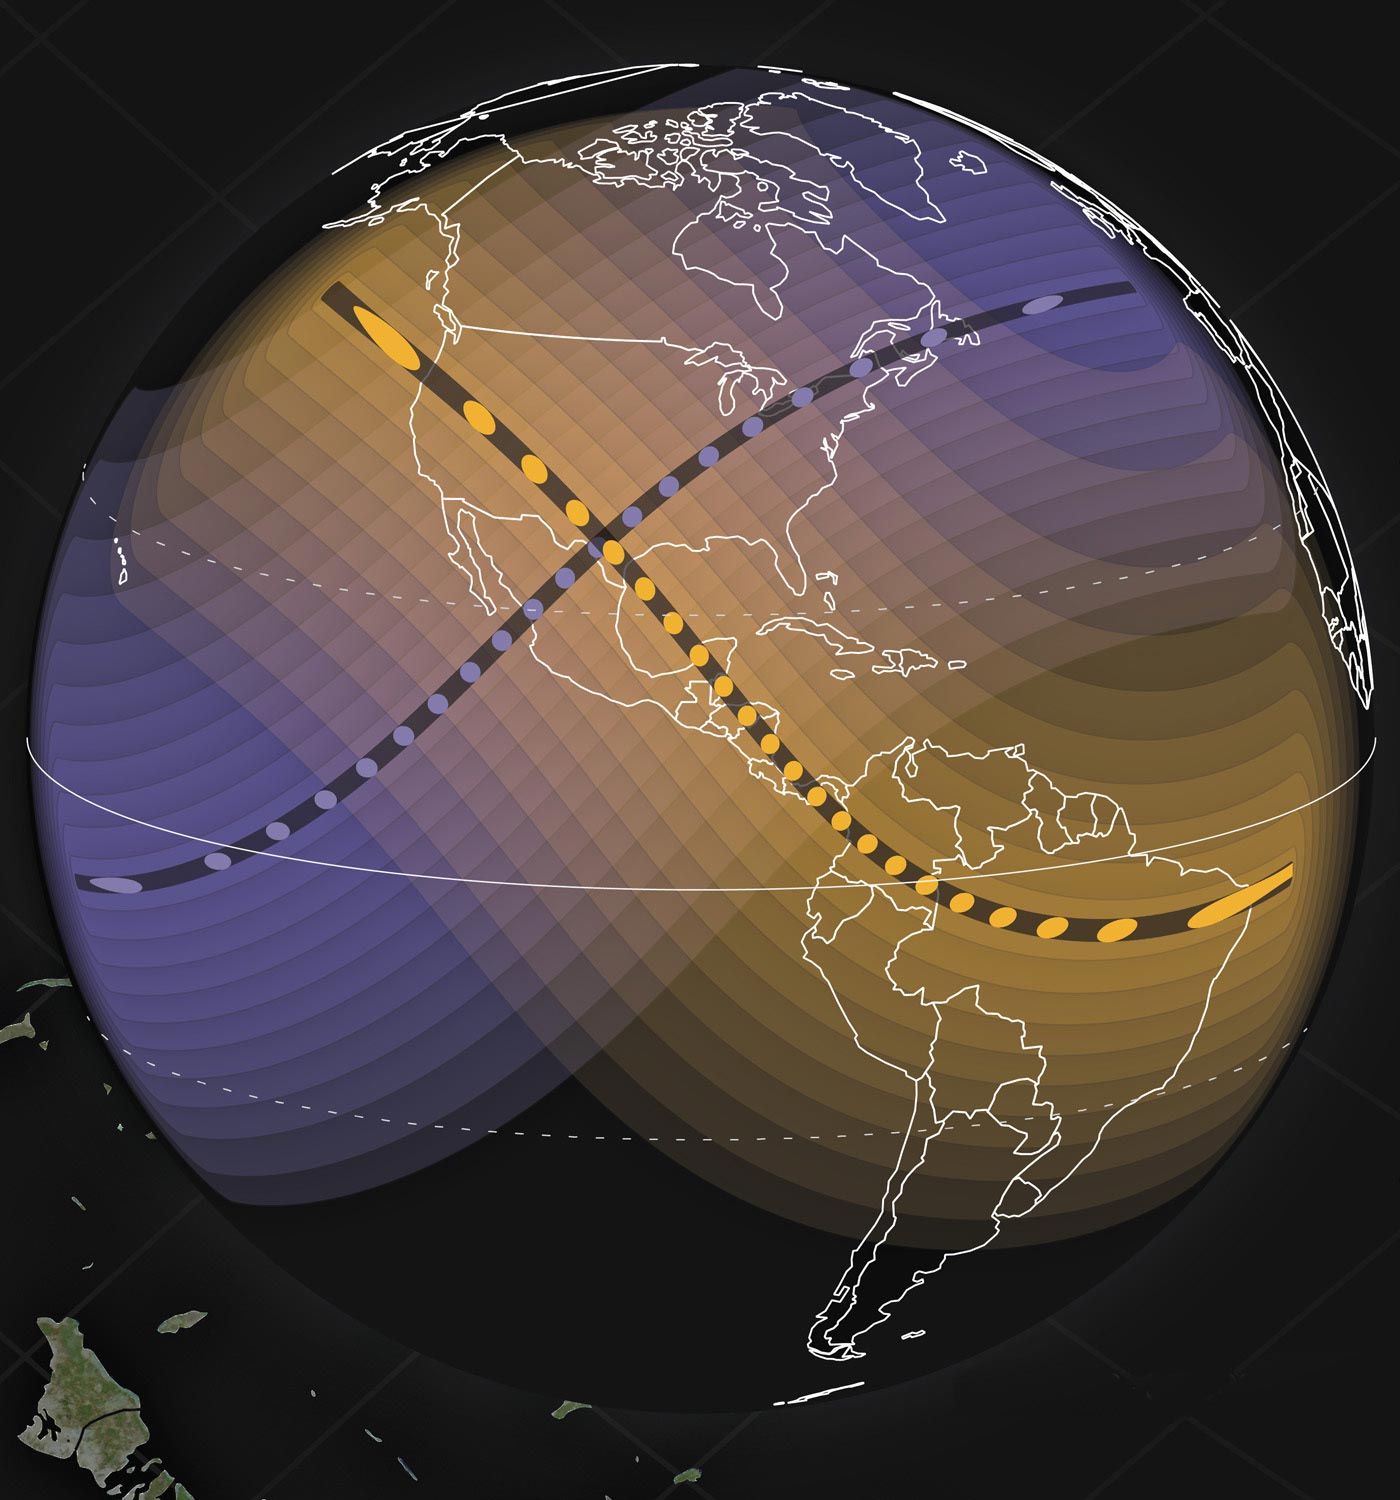
Neither eclipse will be contained to the contiguous U.S., though. In the lower right corner of the NASA map, a globe shows the full paths for both eclipses. The annular eclipse (in yellow and black) extends into Mexico, Central America, and South America. The total eclipse (in purple and black) also crosses Mexico and northeastern Canada. Shaded bands (yellow for the annular eclipse and purple for the total eclipse) also show where a partial eclipse can be seen. For example, in October 2023, southeastern Alaska will experience a partial eclipse, while Hawaii will have a chance to see a partial eclipse in April 2024.
Making the Map
Michala Garrison, a member of the Scientific Visualization Studio (SVS) at NASA’s Goddard Space Flight Center, applied her background in geography and cartography to design the map, incorporating information from a variety of NASA sources.
Earth elevation information came from the Shuttle Radar Topography Mission, while maps of the Moon’s shape were supplied by Lunar Reconnaissance Orbiter. The positions of the Sun, Moon, and Earth were found using software and data from NASA’s Navigation and Ancillary Information Facility. Garrison’s SVS colleague, Ernie Wright, used all of this information to calculate the location and shape of the Moon’s shadow.
NASA’s Blue Marble – a global mosaic of satellite images assembled by the NASA Earth Observatory team – provided color for the land. And one particularly unique feature Garrison thought to add along the path of the 2024 total eclipse was nighttime imagery of Earth from NASA’s Black Marble – which shows city lights on the night side of the planet as imaged by the Suomi NPP spacecraft.
One of Garrison’s goals for the map was to inspire people to get to the paths of the annular and total eclipses, which she didn’t do the last time the Moon’s shadow crossed the continental U.S.
Two solar eclipses will cross the United States in 2023 and 2024. On October 14, 2023, an annular solar eclipse will create a “ring of fire” in the sky from Oregon to Texas. On April 8, 2024, a total solar eclipse will darken the skies from Texas to Maine. On both dates, all 48 contiguous states in the U.S. will experience a partial solar eclipse. A map developed using data from a variety of NASA sources shows both eclipse paths as dark bands. Outside those paths, yellow and purple lines show how much of the Sun will become blocked by the Moon during the partial eclipses. This video zooms in to different parts of the map, explaining these and other features that describe what observers across the country can expect to see during each eclipse.
“In 2017, I was in Maryland, so I still got to see a little bit, because I was in a partial eclipse,” she said. “But I didn’t really know any of this back then. This does make me want to go to, say, Albuquerque in 2023. And then in 2024 to go more south.”
Garrison worked through many revisions to try to make the map both aesthetic and practical, to help people both inside and outside the paths to plan their eclipse experience.
“It took a lot of trial and error. I wanted it to be useful to the reader but not overwhelming – and still be a pretty product to look at to catch people’s eye.”
Never miss a breakthrough: Join the SciTechDaily newsletter.
Follow us on Google and Google News.
4 Comments
These solar & lunar eclipses, annular & total, blood moons, meteor showers, comets movements in our galaxy, solar system, all of this is thrilling to me!
Please keep informing me/us about the cosmos, universe, activities.
keep me posted
Thanks!
Giving facts about eclipse is imperative that gives All round change on earthing reviews and technological advancement.
Can you see anything in Washinton State near Yakima. And Peoria, Il.