In 2024, Earth experienced its hottest year on record, surpassing previous highs with an average temperature 1.28 degrees Celsius above the 20th-century norm.
This historical peak is a stark reminder of the urgent need to understand and mitigate our impact on the planet, amid ongoing climate crises like wildfires and rising sea levels.
Record-Breaking Heat in 2024
Earth’s surface temperature in 2024 was the highest ever recorded, according to a NASA-led analysis.
In 2024, global temperatures were 1.28 degrees Celsius (2.30 degrees Fahrenheit) above NASA’s 20th-century baseline (1951–1980), surpassing the previous record set in 2023. This new milestone followed an unprecedented 15-month streak of monthly temperature records, stretching from June 2023 to August 2024.
“Once again, the temperature record has been shattered — 2024 was the hottest year since record-keeping began in 1880,” said NASA Administrator Bill Nelson. “Between record-breaking temperatures and wildfires currently threatening our centers and workforce in California, it has never been more important to understand our changing planet.”
Long-Term Climate Impacts
NASA scientists further estimate Earth in 2024 was about 1.47 degrees Celsius (2.65 degrees Fahrenheit) warmer than the 1850–1900 average. For more than half of 2024, average temperatures were more than 1.5 degrees Celsius above the baseline, and the annual average, with mathematical uncertainties, may have exceeded the level for the first time.
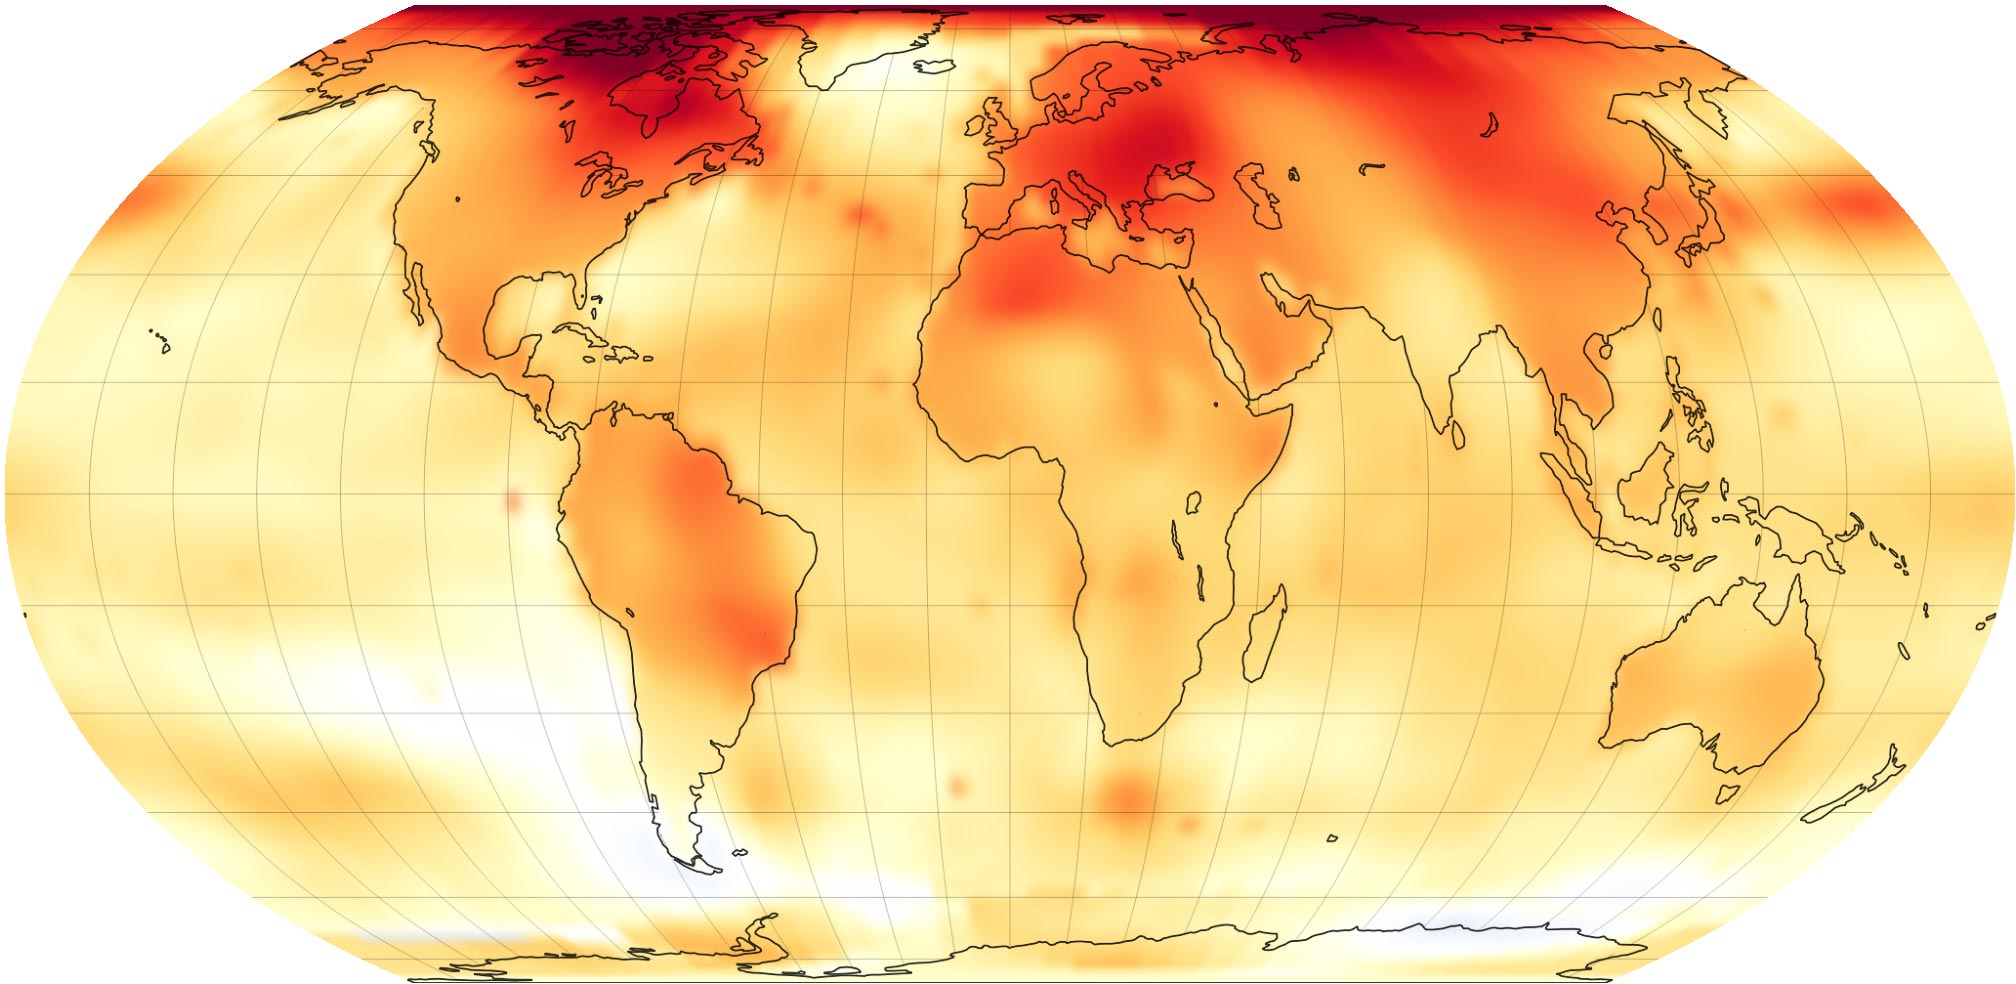
The map above depicts global temperature anomalies in 2024. It does not show absolute temperatures; instead, it shows how much warmer or cooler each region of Earth was compared to the average from 1951 to 1980. The bar chart below shows 2024 in context with temperature anomalies since 1880. The values represent surface temperatures averaged over the entire globe for the year.

Comparing Past and Present Climates
“The Paris Agreement on climate change sets forth efforts to remain below 1.5 degrees Celsius over the long term. To put that in perspective, temperatures during the warm periods on Earth three million years ago—when sea levels were dozens of feet higher than today—were only around 3 degrees Celsius warmer than pre-industrial levels,” said Gavin Schmidt, director of NASA’s Goddard Institute for Space Studies (GISS) in New York. “We are halfway to Pliocene-level warmth in just 150 years.”
Scientists have concluded the warming trend of recent decades is driven by heat-trapping carbon dioxide, methane, and other greenhouse gases. In 2022 and 2023, Earth saw record increases in carbon dioxide emissions from fossil fuels, according to a recent international analysis. The concentration of carbon dioxide in the atmosphere has increased from pre-industrial levels in the 18th century of approximately 278 parts per million to about 420 parts per million today.
NASA and other federal agencies regularly collect data on greenhouse gas concentrations and emissions. These data are available at the U.S. Greenhouse Gas Center, a multi-agency effort that consolidates information from observations and models, with a goal of providing decision-makers with one location for data and analysis.
Exceptional heat trends
The temperatures of individual years can be influenced by natural climate fluctuations such as El Niño and La Niña, which alternately warm and cool the tropical Pacific Ocean. The strong El Niño that began in fall 2023 helped nudge global temperatures above previous records.
The heat surge that began in 2023 continued to exceed expectations in 2024, Schmidt said, even though El Niño abated. Researchers are working to identify contributing factors, including possible climate impacts of the January 2022 Tonga volcanic eruption and reductions in pollution, which may change cloud cover and how solar energy is reflected back into space.
“Not every year is going to break records, but the long-term trend is clear,” Schmidt said. “We’re already seeing the impact in extreme rainfall, heat waves, and increased flood risk, which are going to keep getting worse as long as emissions continue.”
Seeing changes locally
NASA assembles its temperature record using surface air temperature data collected from tens of thousands of meteorological stations, as well as sea surface temperature data acquired by ship- and buoy-based instruments. These data are analyzed using methods that account for the varied spacing of temperature stations around the globe and for urban heating effects that could skew the calculations.
A new assessment published earlier this year by scientists at the Colorado School of Mines, the National Science Foundation, the National Atmospheric and Oceanic Administration (NOAA), and NASA further increases confidence in the agency’s global and regional temperature data.
“When changes happen in the climate, you see it first in the global mean, then you see it at the continental scale and then at the regional scale. Now, we’re seeing it at the local level,” Schmidt said. “The changes occurring in people’s everyday weather experiences have become abundantly clear.”
Independent studies conducted by NOAA, Berkeley Earth, the Hadley Centre (part of the UK Met Office), and Copernicus Climate Services in Europe have all confirmed that 2024 had the highest global surface temperatures since modern record-keeping began. While these organizations analyze much of the same temperature data, they employ different methods and models in their assessments. Despite these variations, all findings point to the same consistent warming trend.
NASA’s full dataset of global surface temperatures, as well as details of how NASA scientists conducted the analysis, are publicly available from GISS, a NASA laboratory managed by the agency’s Goddard Space Flight Center.
NASA Earth Observatory images by Michala Garrison, based on data from the NASA Goddard Institute for Space Studies.
Never miss a breakthrough: Join the SciTechDaily newsletter.
Follow us on Google and Google News.
3 Comments
“On record” only means “in the last 150 years”. Earth is known to have been warmer than that in the further past.
And speaking of the said “record” – how do we even know that the measurements stayed continuously valid and comparable over the course of those 150 years? The number and the position of weather stations have changed, the coverage has changed and the ways of measuring temperature have changed during that period.
I just don’t buy that they could’ve normalized all the data without a lot of statistical trickery. So that “record” should be taken with a large chunk of salt.
And also a lot colder in the further past. I suppose the Jurassic-Cretaceous might have been warmer………….
“In 2024, global temperatures were 1.28 degrees Celsius … above NASA’s 20th-century baseline (1951–1980), surpassing the previous record set in 2023.”
No where does the article state what the uncertainty (aka margin of error) is. This is an important oversight because the uncertainty allows us to determine if the claimed difference between 2023 and 2024 is statistically significant. That is, while the claimed nominal global average may be larger in 2024, without knowing the standard deviation, and thus the probability that the actual number being other than the nominal average, one can’t be confident that the numbers are really different, despite one appearing larger.
The protocol for handling the uncertainty of measurements is that in the absence of a formal calculation of the uncertainty, one displays the digits that are assumed to be certain (known as the ‘significant figures’), which implies that the uncertainty is +/-0.5 in the next position to the right. That is, for the cited 2024 average, the anomaly is assumed to be 1.28 +/-0.005 degrees Celsius, for a world-wide ‘average.’ However, what is never mentioned is that the daily ‘average’ temperatures that are averaged for the year are not actually an arithmetic mean. Instead, they are mid-range diurnal extreme temperatures. That means they are the median of the daily high and daily low. Even if the probability distribution of the daily temperatures were known, it is unlikely that it would be close to being a Gaussian (normal) distribution because the daytime temperature rise is typically a sinusoidal increase, and the nighttime temperature decline is an exponential decay. What that means is that many of the statistical manipulations that are used to rationalize displaying two (or more) significant figures to the right of the decimal point (e.g. 28) are not valid. That is because the diurnal mid-range value is the same for 20 and 10 as for 30 and 0. The mid-range values alone lose the information about the standard deviation or width of the probability distribution. Starting with measurements that don’t have any information about the shape of the distribution (mean, standard deviation, skewness) of what is unlikely to be close to having a normal distribution, and could even be mutimodal, derived from thermometers that some of which may only be read to the nearest 0.5 degrees C, I think it is unlikely that the “8” is actually significant. However, we don’t know, because that information isn’t provided.
When this subject is discussed, it is commonly claimed that using the standard error of the mean, it is justified to divide the standard deviation by the square root of the number of readings, thus increasing the precision. However, what that gives us is the precision of the average of the mid-range values, not the precision of the average of all daily temperatures. Lastly, because if I haven’t already lost the ‘average’ reader by now, one is only justified in improving the precision by dividing by the square root of all the readings if all non-random variations are removed from the data. As a practical matter, that means the same thing must be measured every time (not similar parcels of air as winds pass over the station), using the same thermometer for every reading, and (if analog) read by the same observer. There are other issues as well, such as the requirement of stationarity, which means that neither the mean or standard vary with time. Basically, using the standard error of the mean is most appropriately applied to things like measuring the angle turned by a land surveyor with a transit, or measuring the diameter of a ball bearing.
Strictly speaking, a rigorous definition of the so-called “average, annual global temperature” should be called the ensemble average of sampled diurnal mid-range temperatures. Again, I doubt that a rigorous analysis of the data processing, with a formal propagation of error analysis, would support a claim with a precision greater than about +/- 0.5 degrees C. The authors of articles like this are depending on readers not being critical, or not having the familiarity with measurements and statistics to question the claims. This is what is being called “science” today.