Earth in July 2023 was 1.18°C (2.12°F) warmer than the average for the month, and warmer than any other month in the 143-year record.
According to an analysis by scientists at NASA’s Goddard Institute for Space Studies (GISS), July 2023 was hotter than any other month in the global temperature record.
“This July was massively warmer than any previous July and any previous month on record, which goes back to 1880,” said GISS Director Gavin Schmidt. “This continues the long-term trend in dramatic warming that we have seen over the past four decades.”
Temperature Anomalies and Impacts
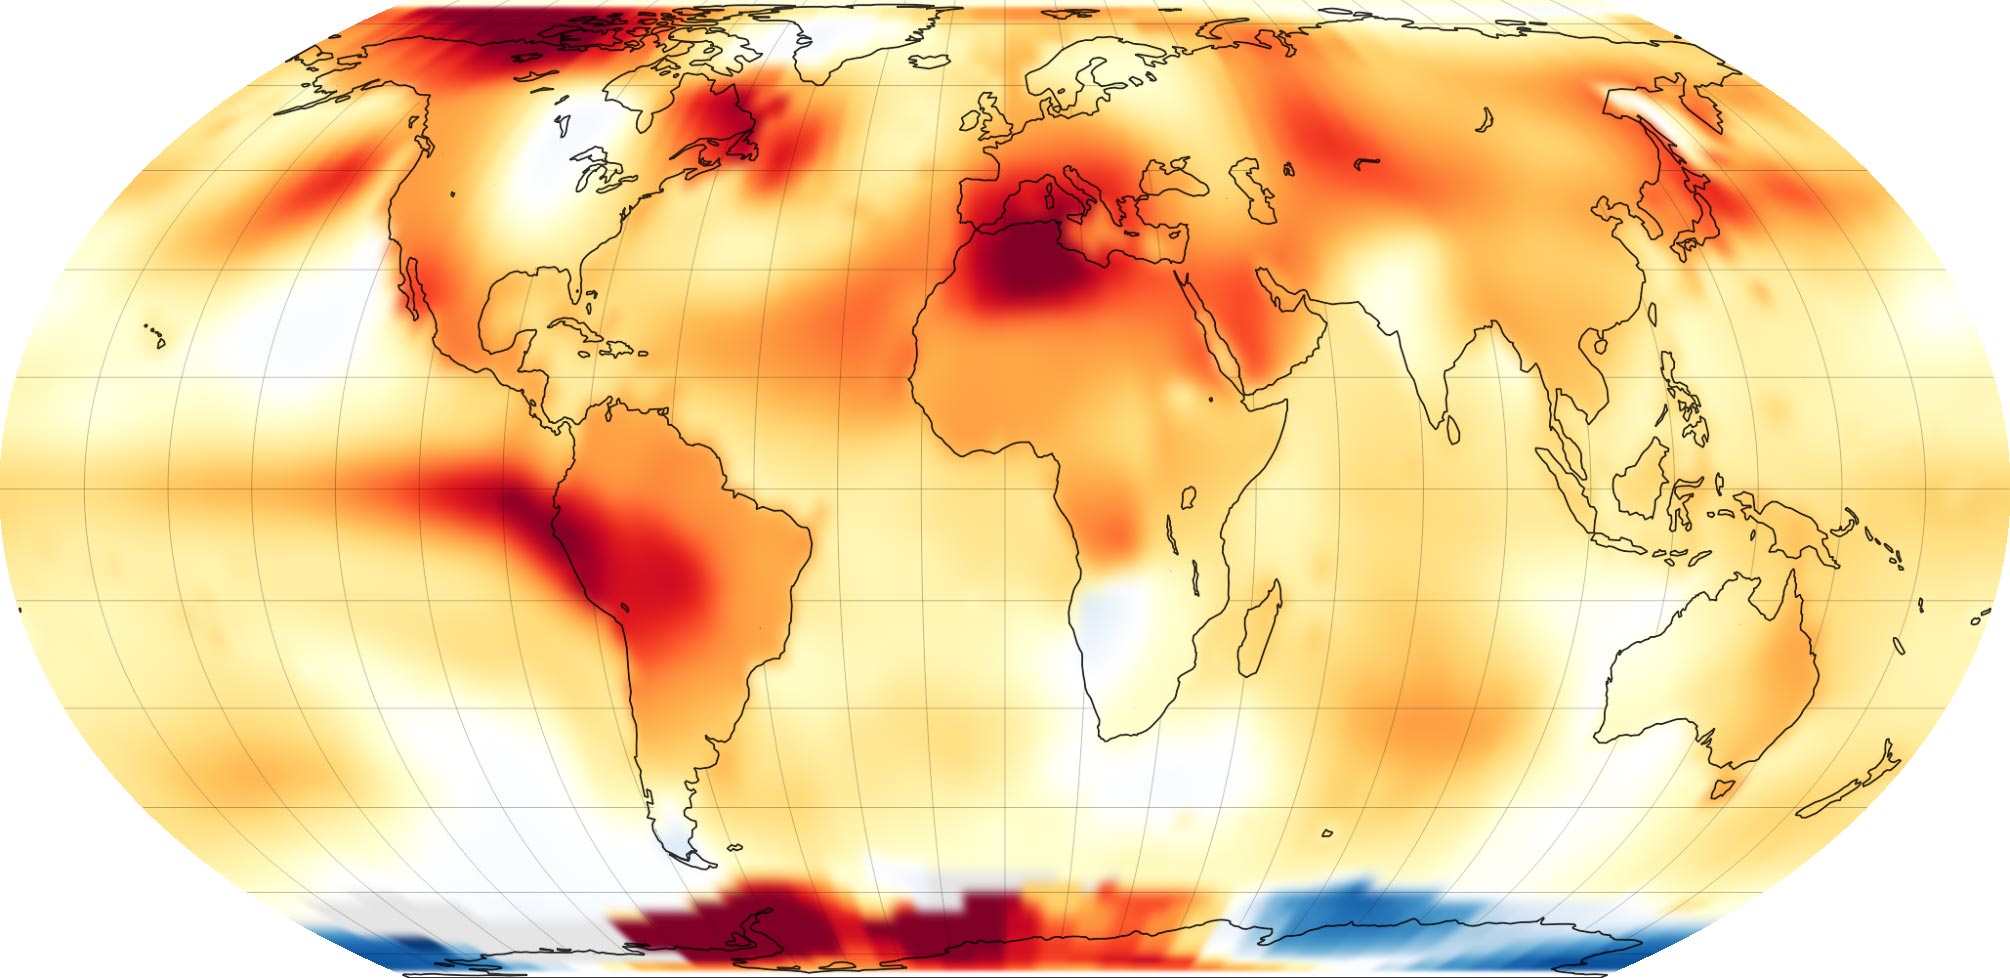
The map at the top of the page depicts global temperature anomalies for July 2023. It shows how much warmer or cooler the Earth was compared to the baseline average from 1951 to 1980. Note that the deepest reds are at least 4° Celsius (7° Fahrenheit) above the monthly mean.
Parts of South America, North Africa, North America, and the Antarctic Peninsula were especially hot and experienced temperature anomalies around 4°C. But it was not unusually warm everywhere. Parts of the U.S. Midwest and northern Europe saw closer to average temperatures. Overall, July 2023 was 1.18°C (2.12°F) warmer than the average July between 1951 and 1980.
Factors Driving the Trend
The warmer-than-usual July continues a long-term trend of warming, driven primarily by human-caused greenhouse gas emissions. July 2023 was 0.24°C (0.43°F) warmer than any previous July in NASA’s record. And according to GISS temperature anomaly data, the top-five hottest Julys since 1880 have all happened in the past five years.
Extreme heat contributed to devastating wildfires and blistering heat waves in the Northern Hemisphere. “These changes that we’re seeing in global temperatures are being reflected in real heat extremes that people are experiencing locally,” Schmidt said. “We can say with some confidence now that the heat waves we are seeing in North Africa, the Middle East, the U.S. Southwest, China, and southern Europe are being directly impacted by the fact that the whole planet is warming.”
Data Analysis and Oceanic Factors
The GISS team assembles its temperature analysis from surface air temperature data from tens of thousands of metrological stations and sea surface temperature data acquired by ship- and buoy-based instruments. This raw data is analyzed using methods that account for the varied spacing of temperature stations around the globe and for urban heating effects that could skew the calculations.
High sea surface temperatures contributed to July’s record warmth. The map shows especially warm ocean temperatures in the eastern tropical Pacific, evidence of the El Niño that began developing in May 2023. Phenomena such as El Niño or La Niña, which warm or cool the tropical Pacific Ocean, can contribute a small amount of year-to-year variability in global temperatures. But these contributions are not typically felt when El Niño starts developing during the Northern Hemisphere’s summer.
Anticipated El Niño Impact
“One of the reasons this record is concerning is that the effects of El Niño on global temperatures normally have a several month lag and are felt in the winter and spring,” said Schmidt. “Even though we have an El Niño developing now, the record warmth we are seeing is not yet related to that in a significant way. We expect to see the biggest impacts of the developing El Niño in February, March, and April 2024.”
NASA’s full temperature data set and the complete methodology used for the temperature calculation and its uncertainties are available here.
NASA Earth Observatory images by Lauren Dauphin, based on data from the NASA Goddard Institute for Space Studies.
Never miss a breakthrough: Join the SciTechDaily newsletter.
Follow us on Google and Google News.
2 Comments
“This continues the long-term trend in DRAMATIC warming that we have seen over the past four decades.”
I wouldn’t call ~0.5 deg C in 40 years “dramatic” without stating what the uncertainty is in individual temperature measurements. NASA commonly, and unjustifiably, increases the claimed precision of average temperatures. Increasing precision in proportion to the square-root of the number of measurements is only justified when the thing being measured doesn’t change over the time that it is being measured, and the same thing is measured with the same thermometer. What is measured is tens of thousands of different parcels of air with tens of thousands of different thermometers, each with different calibration curves. That does not meet the requirement of measuring a stationary variable many times with the same instrument.
“…, the top-five hottest Julys since 1880 have all happened in the past five years.” That is a non sequitur! If one has an increasing time-series, which reaches a plateau, one could truthfully make such a statement to include virtually all the years of the plateau, whether they be 10 or 100. The statement sounds impressive, but doesn’t really tell us much.
“Human-caused emissions and high sea surface temperatures are significant contributors.”
Indeed, others have suggested that the ‘record’ high temperature was not the result of actual measurements, but instead, a bug in the computer modeling program that produced predicted anomalously high sea surface temperatures on the Atlantic side of Antarctica (See the illustration at the top of this article.)
This article is not substantially different from the August 15th article (Global Fever) and continues the poor-quality reporting initiated by that article, minus the references to President Biden’s agenda.
The disaster on Maui has been the topic of news for the last week. As usual, the obligatory “climate change” has been mentioned as contributing to the disaster. Look at the map supplied by NASA, and you can see that there was negligible warming around Hawaii in July. Similarly, many, if not most, of the fires in Canada, north of the Great Lakes, show little or no anomalous July warming.