New research led by the University of Cambridge is the first to obtain a detailed ‘image’ of an unusual pocket of rock at the boundary layer with Earth’s core, some three thousand kilometers beneath the surface.
The mysterious area of rock, which is located almost directly beneath the Hawaiian Islands, is one of several ultra-low velocity zones – so-called because earthquake waves slow to a crawl as they pass through them.
The research, published on May 19, 2022, in the journal Nature Communications, is the first to reveal the complex internal variability of one of these pockets in detail, shedding light on the landscape of Earth’s deep interior and the processes operating within it.
“Of all Earth’s deep interior features, these are the most fascinating and complex.” Zhi Li
“Of all Earth’s deep interior features, these are the most fascinating and complex. We’ve now got the first solid evidence to show their internal structure — it’s a real milestone in deep earth seismology,” said lead author Zhi Li, PhD student at Cambridge’s Department of Earth Sciences.
Seismic Waves and Earth’s Deep Interior
Earth’s interior is layered like an onion: at the center sits the iron-nickel core, surrounded by a thick layer known as the mantle, and on top of that a thin outer shell — the crust we live on. Although the mantle is solid rock, it is hot enough to flow extremely slowly. These internal convection currents feed heat to the surface, driving the movement of tectonic plates and fuelling volcanic eruptions.
Scientists use seismic waves from earthquakes to ‘see’ beneath the Earth’s surface — the echoes and shadows of these waves reveal radar-like images of deep interior topography. But, until recently, ‘images’ of the structures at the core-mantle boundary, an area of key interest for studying our planet’s internal heat flow, have been grainy and difficult to interpret.
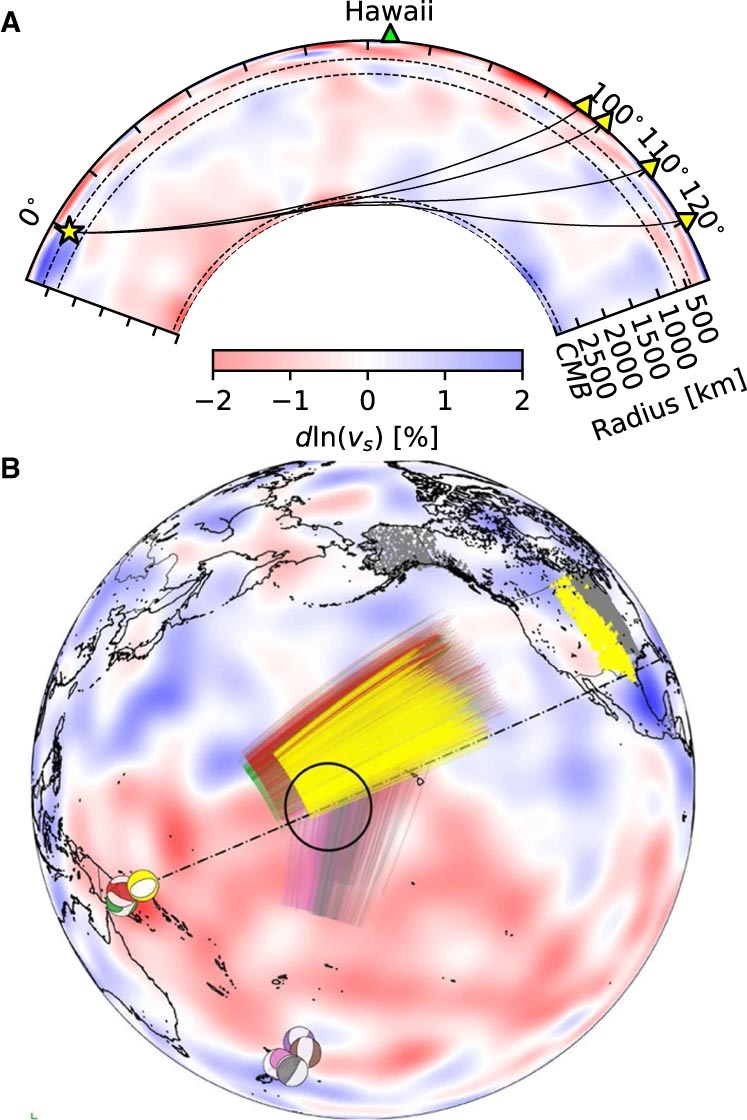
The researchers used the latest numerical modeling methods to reveal kilometer-scale structures at the core-mantle boundary. According to co-author Dr Kuangdai Leng, who developed the methods while at the University of Oxford, “We are really pushing the limits of modern high-performance computing for elastodynamic simulations, taking advantage of wave symmetries unnoticed or unused before.” Leng, who is currently based at the Science and Technology Facilities Council, says that this means they can improve the resolution of the images by an order of magnitude compared to previous work.
Iron-Rich Composition Beneath Hawaii
The researchers observed a 40% reduction in the speed of seismic waves traveling at the base of the ultra-low velocity zone beneath Hawaii. This supports existing proposals that the zone contains much more iron than the surrounding rocks – meaning it is denser and more sluggish. “It’s possible that this iron-rich material is a remnant of ancient rocks from Earth’s early history or even that iron might be leaking from the core by an unknown means,” said project lead Dr Sanne Cottaar from Cambridge Earth Sciences.

Connection Between Ultra-Low Velocity Zones and Volcanic Hotspots
The research could also help scientists understand what sits beneath and gives rise to volcanic chains like the Hawaiian Islands. Scientists have started to notice a correlation between the location of the descriptively-named hotspot volcanoes, which include Hawaii and Iceland, and the ultra-low velocity zones at the base of the mantle. The origin of hotspot volcanoes has been debated, but the most popular theory suggests that plume-like structures bring hot mantle material all the way from the core-mantle boundary to the surface.
With images of the ultra-low velocity zone beneath Hawaii now in hand, the team can also gather rare physical evidence from what is likely the root of the plume feeding Hawaii. Their observation of dense, iron-rich rock beneath Hawaii would support surface observations. “Basalts erupting from Hawaii have anomalous isotope signatures which could either point to either an early-Earth origin or core leaking, it means some of this dense material piled up at the base must be dragged to the surface,” said Cottaar.
Mapping the Core-Mantle Boundary
More of the core-mantle boundary now needs to be imaged to understand if all surface hotspots have a pocket of dense material at the base. Where and how the core-mantle boundary can be targeted does depend on where earthquakes occur, and where seismometers are installed to record the waves.
The team’s observations add to a growing body of evidence that Earth’s deep interior is just as variable as its surface. “These low-velocity zones are one of the most intricate features we see at extreme depths – if we expand our search, we are likely to see ever-increasing levels of complexity, both structural and chemical, at the core-mantle boundary,” said Li.
They now plan to apply their techniques to enhance the resolution of imaging of other pockets at the core-mantle boundary, as well as mapping new zones. Eventually, they hope to map the geological landscape across the core-mantle boundary and understand its relationship with the dynamics and evolutionary history of our planet.
Reference: “Kilometer-scale structure on the core–mantle boundary near Hawaii” by Zhi Li, Kuangdai Leng, Jennifer Jenkins and Sanne Cottaar, 19 May 2022, Nature Communications.
DOI: 10.1038/s41467-022-30502-5
Never miss a breakthrough: Join the SciTechDaily newsletter.
Follow us on Google and Google News.
9 Comments
Scientists are supposed to be mathematicians. The graph of slopes from seismological P-waves showing their path of travel through the Earth’s interior should be concave with the actual path closely following the perimeter of the Earth. The curvature is close enough to prevent the path of travel from descending very deep into the Earth’s interior, and also close enough to prevent the path of travel from ascending to where it would disappear. The image in the article shows the P-wave path of travel as being convex. I’ve already documented this thoroughly a number of years ago as being false.
As a P-wave descends into the interior, the closer to the surface of the Earth, mass through which the wave travels results in the wave traveling fastest. As the wave descends, it slows down. Draw a line through the center of the epicenter tangent to the Earth’s surface. As a P-wave travels along that line, a line tangent to that perimeter has a slope tilting progressively forward. A line perpendicular to the tangent is the direction of travel. The slope of that line tilts forward causing a concave path of travel from the point of origin, from the epicenter. Try studying https://www.physicsclassroom.com/mmedia/vectors/bds.cfm. The article should give you a better understanding of the affects of the interior of the Earth upon the path of travel of a P-wave.
I’m inclined to believe the reason scientists have this so wrong is that a correct interpretation of P-wave travel though the interior of the Earth proves the Earth is ‘hollow’. Scientists can’t accept that finding so they fudge their interpretation of the data to fit their beliefs that the interior of the Earth is solid. Actual P-wave data reveals the Earth’s mass to be divided among the outer 12.5% of the Earth’s diameter. Also lookup and study ‘torus’. The Earth’s perimeter is that of a torus as the shell of a sphere. I don’t know if math has a definition of a torus in that regard.
Think of a space station surrounded by a torus with the occupants living inside the torus section of the space station, with the perimeter being rotated to produce artificial graity. Only, instead of a doughnut surrounding the perimeter of the space station, think of what that torus would be like if it completely encompassed a sphere.
Yes, anyone reading my statement likely just declared I’m an idiot who knows nothing about physics. Some people in Mensa agree with you and suggested I do some college level reading. I did as they asked. There wasn’t anything in the college texts that I didn’t already know. However, knowing something doesn’t mean agreeing with that something. The college texts aren’t always correct.
“The progress of science is strewn….with the….skeletons of discarded theories which once seemed to possess eternal life.” -A. Koestler, “The Ghost in the Machine”
A number of centuries ago, scientists realized the Earth isn’t flat. It past time for scientists to realize the Earth isn’t solid. In fact, the Sun is hollow as well. Its easy to prove if you think about it. If you refuse to consider it, then you’ll never realize it.
I excelled in college math with a tendency to get perfect 100’s on college homework and exams. I know my math.
Scientists are of course not generally mathematicians (or vice versa), but they are proficient math users.
The image as well as the paper use shear waves, as mentioned already in the abstract. Maybe you should read the paper before criticising it.
Pressure waves (P waves) are generally refracted according to the increase in density towards the lower density surface material, i.e. from the slower speeds at the surface to the faster deeper down. This is analogously to what light would do when passing from a slower to a faster medium (Snell’s law).
No, Earth is not hollow, it can’t be since surface rock strength does not allow mountains larger than 10 km and rock strength doesn’t build that fast – and the P (and S) waves show it. Which is likely why you claim they refract differently from what we would expect.
By the way, I see a lot if irrelevant bragging but no references to peer reviewed published science papers (documentation).
I’m sorry it took me so long to notice there were responses to my post.
I’m aware of some scientific claims that under the right conditions, fluidity with depth can decrease. A bit of that has to do with scientists claim a solid inner iron core exists at the center of the planet. My observations of charted P-wave data involve a bit more than that. However, I’ll thoroughly research what you’ve stated and see how that affects my findings.
So if nickel presses to heat and pressure 4000kalvin makes crystal what does that mean for the earth’s core and magneto sphere?
Lavalamp Earth
The core of this planet is not going to be a maximum entropy solid. It is going to be a minimum entropy plasma called quark plasma. Probably half of the circumference of this planet is quark plasma in the core. Above this reaction is a thin layer of neutrons, then a thin layer of hydrogen, then helium. The elements keep getting heavier until it is a soup of lave with giant masses of rock that are the “blobs” scientists see. The closer to the surface, the more cooled it gets to the point it all solidifies.
The Lambda-CDM model created the solid iron core out of a cloud of gas and dust. That isn’t how it happened. The “Big Bang” was our universe turning itself into a gargantuan particle collider with the galaxies being quark plasma shrapnel. Everything already had all its energy. Our planet was initially a mass of this plasma. All the elements are created from the outside of the plasma inward. The quark plasma is the energy that allows all these reactions to take place. It is the way our universe carries out the conservation of energy and mass laws. Supernovae simply do not exist.
Same answer as above, both our models and the observations tell us Earth isn’t hollow and plasma filled.
Pure bollocks from your side.
They pressed between two diamonds nickel which makes up our core. The nickel formed crystal branches as a tree. Take your research. Back to your lab.
As the binary star system that we live in, OUR planet was created by placing a Dyson sphere around the Sun’s star partner, a white dwarf star.
This accounts for why we not only have neutrino particles being detected coming from OUR Sun. But the neutrino’s are also coming from the core of our planet.
There is also a 100 mile thick ocean of oil that surrounds the entire core or “star” of OUR planet. I’m just saying…