
New time-lapse videos of Earth’s glaciers and ice sheets as seen from space – some spanning nearly 50 years – are providing scientists with new insights into how the planet’s frozen regions are changing.
At a media briefing on December 9, 2019. at the annual meeting of the American Geophysical Union in San Francisco, scientists released new time series of images of Alaska, Greenland, and Antarctica using data from satellites including the NASA-U.S. Geological Survey Landsat missions. One series of images tells illustrates the dramatic changes of Alaska’s glaciers and could warn of future retreat of the Hubbard Glacier. Over Greenland, different satellite records show a speed-up of glacial retreat starting in 2000, as well as meltwater ponds spreading to higher elevations in the last decade, which could potentially speed up ice flow. And in Antarctic ice shelves, the view from space could reveal lakes hidden beneath the winter snow.
Using images from the Landsat mission dating back to 1972 and continuing through 2019, glaciologist Mark Fahnestock of the University of Alaska Fairbanks, has stitched together six-second time-lapses of every glacier in Alaska and the Yukon.
“We now have this long, detailed record that allows us to look at what’s happened in Alaska,” Fahnestock said. “When you play these movies, you get a sense of how dynamic these systems are and how unsteady the ice flow is.”
New time-lapse videos of Earth’s glaciers and ice sheets as seen from space – spanning nearly 50 years – are providing scientists with new insights into how the planet’s frozen regions are changing.
Using images from the Landsat mission dating back to 1972 and continuing through 2019, glaciologist Mark Fahnestock of the University of Alaska Fairbanks, has stitched together six-second time-lapses of every glacier in Alaska and the Yukon. The videos clearly illustrate what’s happening to Alaska’s glaciers in a warming climate. Some show surges that pause for a few years, or lakes forming where ice used to be, or even the debris from landslides making its way to the sea. Other glaciers show patterns that give scientists hints of what drives glacier changes.
Credit: Mark Fahnestock, Geophysical Institute, University of Alaska Fairbanks, NASA’s Goddard Space Flight Center
The videos clearly illustrate what’s happening to Alaska’s glaciers in a warming climate, he said, and highlight how different glaciers respond in varied ways. Some show surges that pause for a few years, or lakes forming where ice used to be, or even the debris from landslides making its way to the sea. Other glaciers show patterns that give scientists hints of what drives glacier changes.
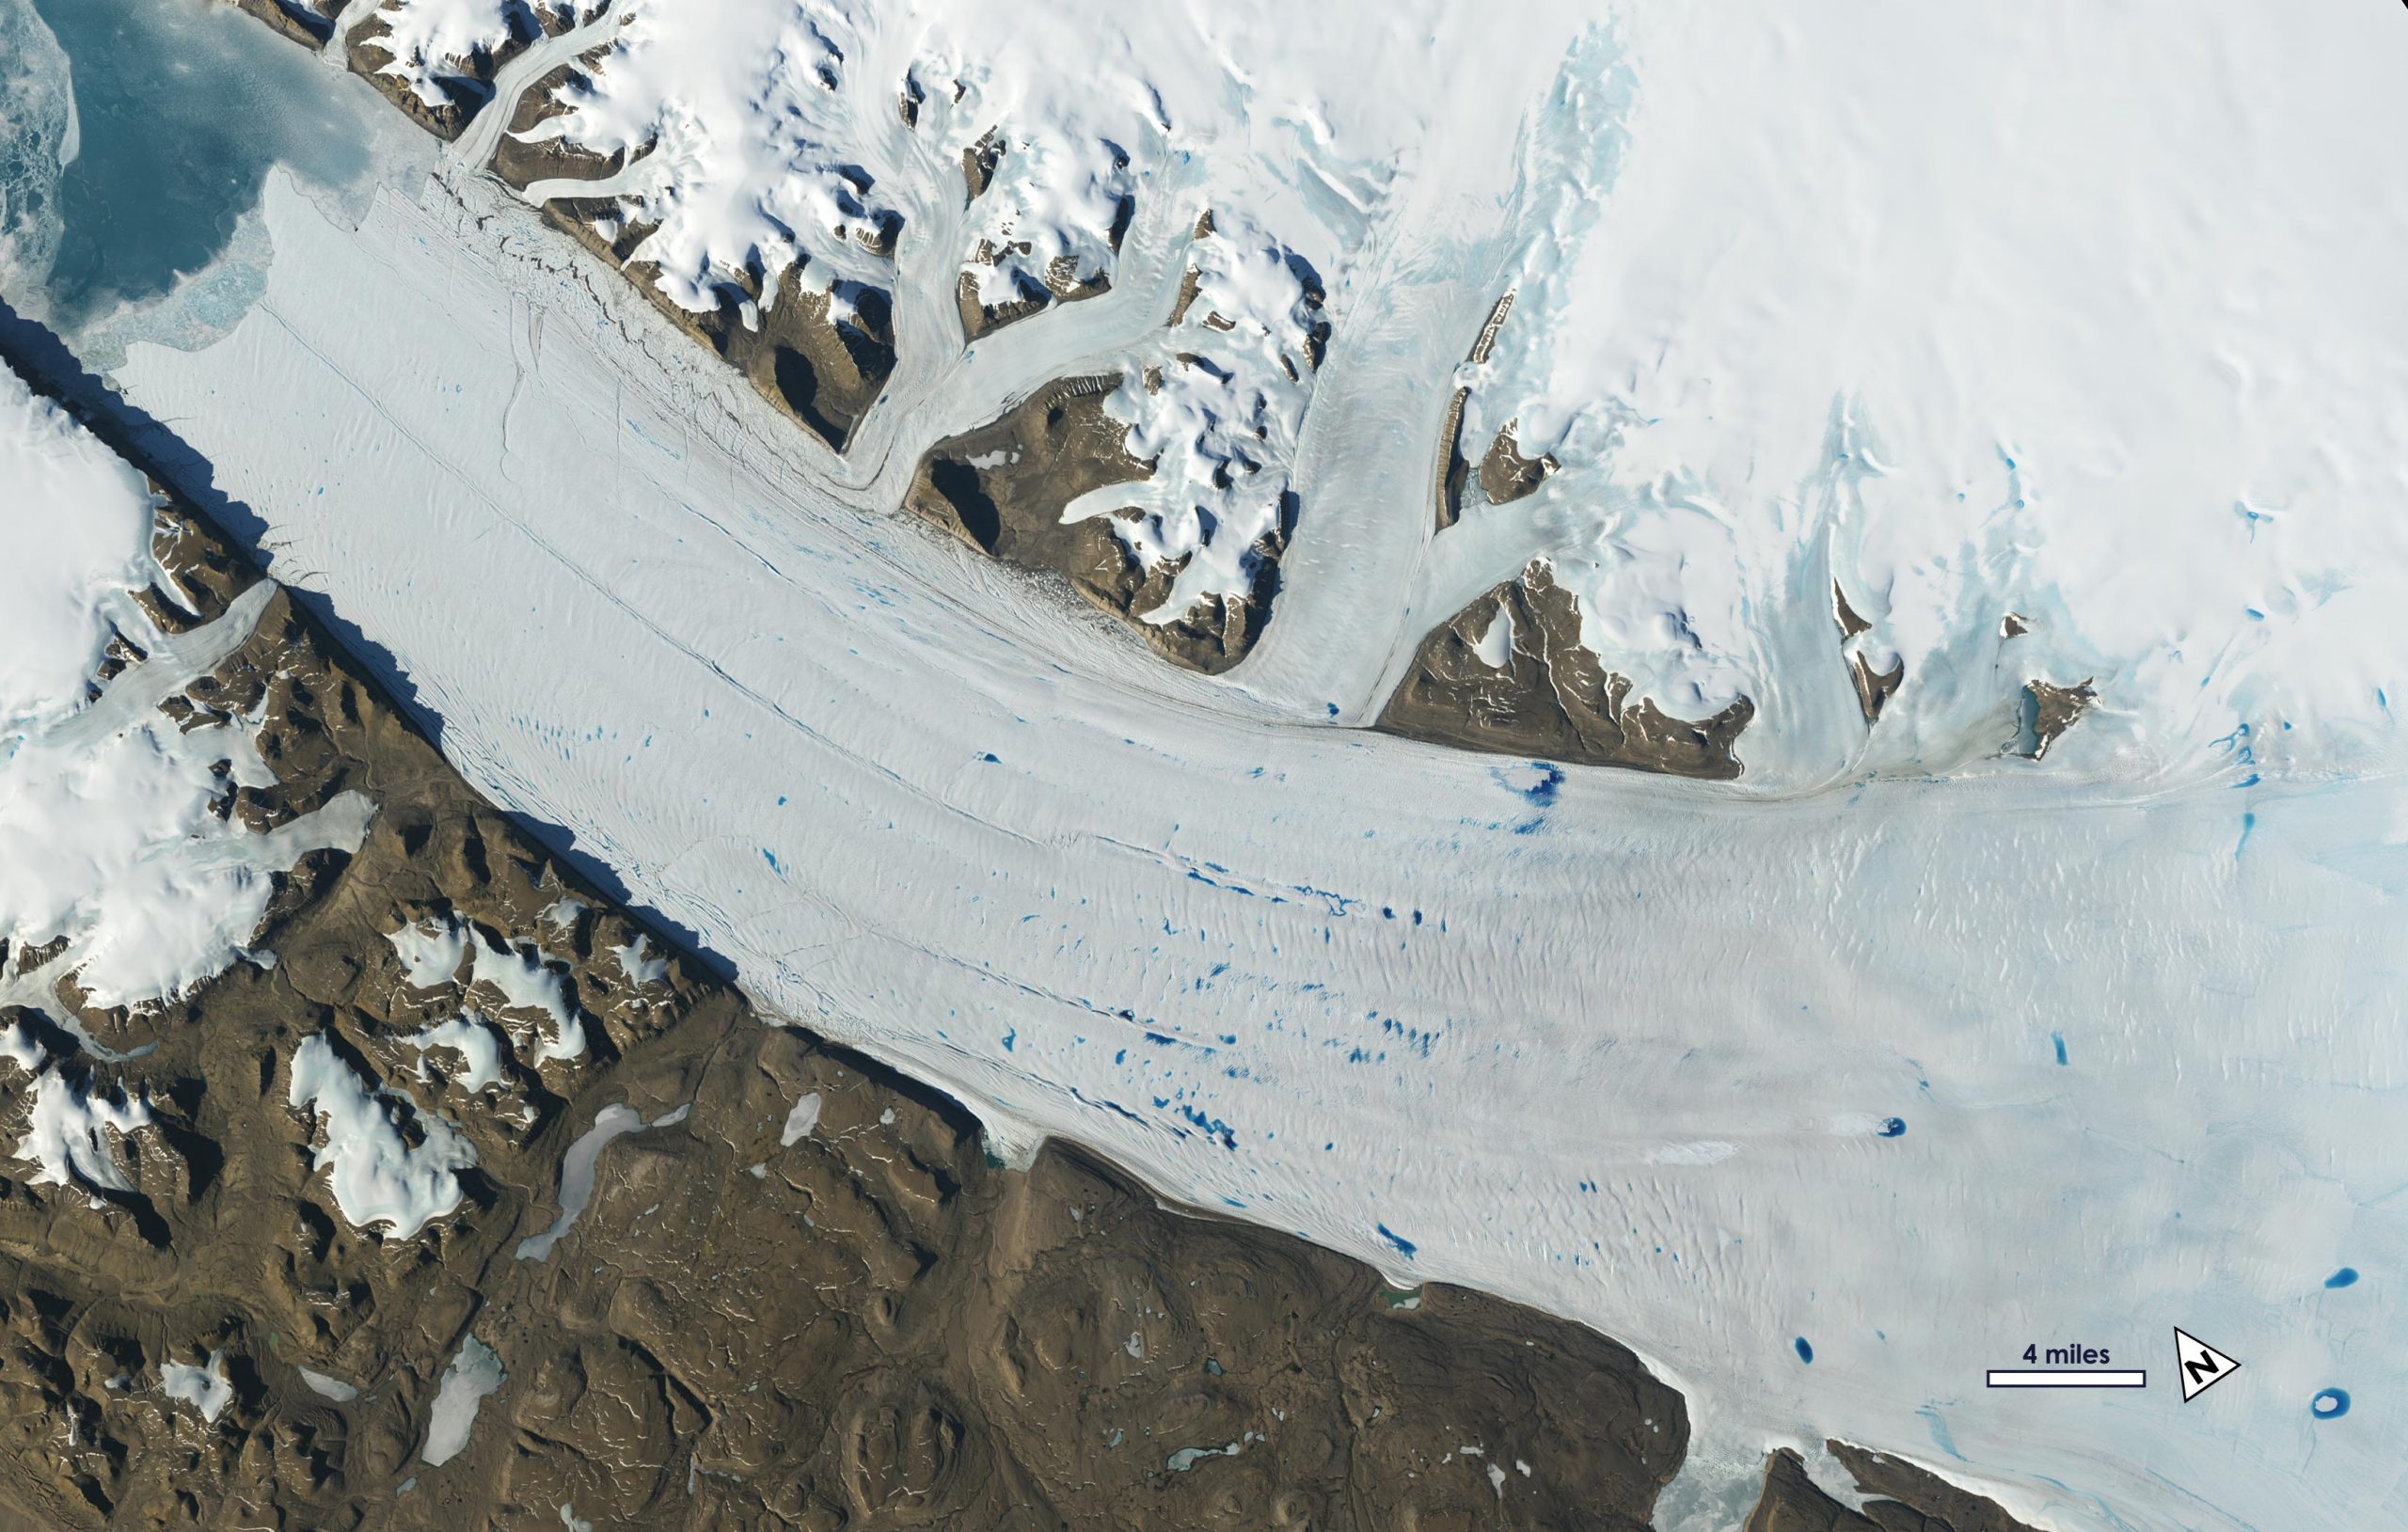
The Columbia Glacier, for example, was relatively stable when the first Landsat satellite was launched in 1972. But starting in the mid-1980s, the glacier’s front began retreating rapidly, and by 2019 was 12.4 miles (20 kilometers) upstream. In comparison, the Hubbard Glacier has advanced 3 miles (5 km) in the last 48 years. But Fahnestock’s time-lapse ends with a 2019 image that shows a large indentation in the glacier, where ice has broken off.
“That calving embayment is the first sign of weakness from Hubbard Glacier in almost 50 years – it’s been advancing through the historical record,” he said. If such embayments persist in the coming years, it could be a sign that change could be coming to Hubbard, he said: “The satellite images also show that these types of calving embayments were present in the decade before Columbia retreated.”
The Landsat satellites have provided the longest continuous record of Earth from space. The USGS has reprocessed old Landsat images, which allowed Fahnestock to handpick the clearest Landsat scenes for each summer, over each glacier. With software and computing power from Google Earth Engine, he created a series of time-lapse videos.
Scientists are using long-term satellite records to look at Greenland glaciers as well. Michalea King of Ohio State University analyzed data from Landsat missions dating back to 1985 to study more than 200 of Greenland’s large outlet glaciers. She examined how far the glacier fronts have retreated, how fast the ice flows, and how much ice glaciers are losing over this time span.
She found that Greenland’s glaciers retreated an average of about 3 miles (5 km) between 1985 and 2018 – and that the most rapid retreat occurred between 2000 and 2005. And when she looked at the amount of glacial ice entering the ocean, she found that it was relatively steady for the first 15 years of the record, but then started increasing around 2000.
“These glaciers are calving more ice into the ocean than they were in the past,” King said. “There is a very clear relationship between the retreat and increasing ice mass losses from these glaciers during the 1985-through-present record. “While King is analyzing ice lost from the front of glaciers, James Lea of the University of Liverpool in the United Kingdom is using satellite data to examine ice melting on top of Greenland’s glaciers and ice sheets, which creates meltwater lakes.
These meltwater lakes can be up to 3 miles (5 km) across and can drain through the ice in a matter of hours, Lea said, which can impact how fast the ice flows. With the computing power of Google Earth Engine, Lea analyzed images of the Greenland ice sheet from the Moderate Resolution Imaging Spectroradiometer (MODIS) on the Terra satellites for every day of every melt season over the last 20 years – more than 18,000 images in all.
“We looked at how many lakes there are per year across the ice sheet and found an increasing trend over the last 20 years: a 27 percent increase in lakes,” Lea said. “We’re also getting more and more lakes at higher elevations – areas that we weren’t expecting to see lakes in until 2050 or 2060.”
When these high-elevation meltwater ponds punch through the ice sheet and drain, it could cause the ice sheet to speed up, he said, thinning the ice and accelerating its demise.
It doesn’t always take decades worth of data to study polar features – sometimes just a year or two will provide insights. The Antarctic ice sheet experiences surface melt, but there are also lakes several meters below the surface, insulated by layers of snow. To see where these subsurface lakes are, Devon Dunmire of the University of Colorado, Boulder, used microwave radar images from the European Space Agency’s Sentinel-1 satellite. Snow and ice are basically invisible to microwave radiation, but liquid water strongly absorbs it.
Dunmire’s new study, presented at the AGU meeting, found lakes dotting the George VI and Wilkins ice shelves near the Antarctic Peninsula – even a few that remained liquid throughout the winter months. These hidden lakes might be more common than scientists had thought, she said, noting that she is continuing to look for similar features across the continent’s ice shelves.
“Not much is known about the distribution and quantity of these subsurface lakes, but this water appears to be prevalent on the ice shelf near the Antarctic peninsula,” Dunmire said, “and it’s an important component to understand because meltwater has been shown to destabilize ice shelves.”
Never miss a breakthrough: Join the SciTechDaily newsletter.
Follow us on Google and Google News.
6 Comments
Months of change I would say. But nice propaganda.
Patrick McAlister, your nonsense comment doesn’t deserve to be dignified with a factual reply.
Speaking of nonsense !
Do you think we caused the ice age to end? Patrick correctly called it for what it is: propaganda. How else can they shame the sheeple into using ev vehicles (which use coal ironically to power their quick charge stations!!) Lol we didn’t cause the ice age to end wake the f*** up people…love is the only thing that’s real.
Patrick, I would recommend you reconsider your previous statement to mitigate any confusion that may have occurred
There is nothing to discuss you guys are crazy.