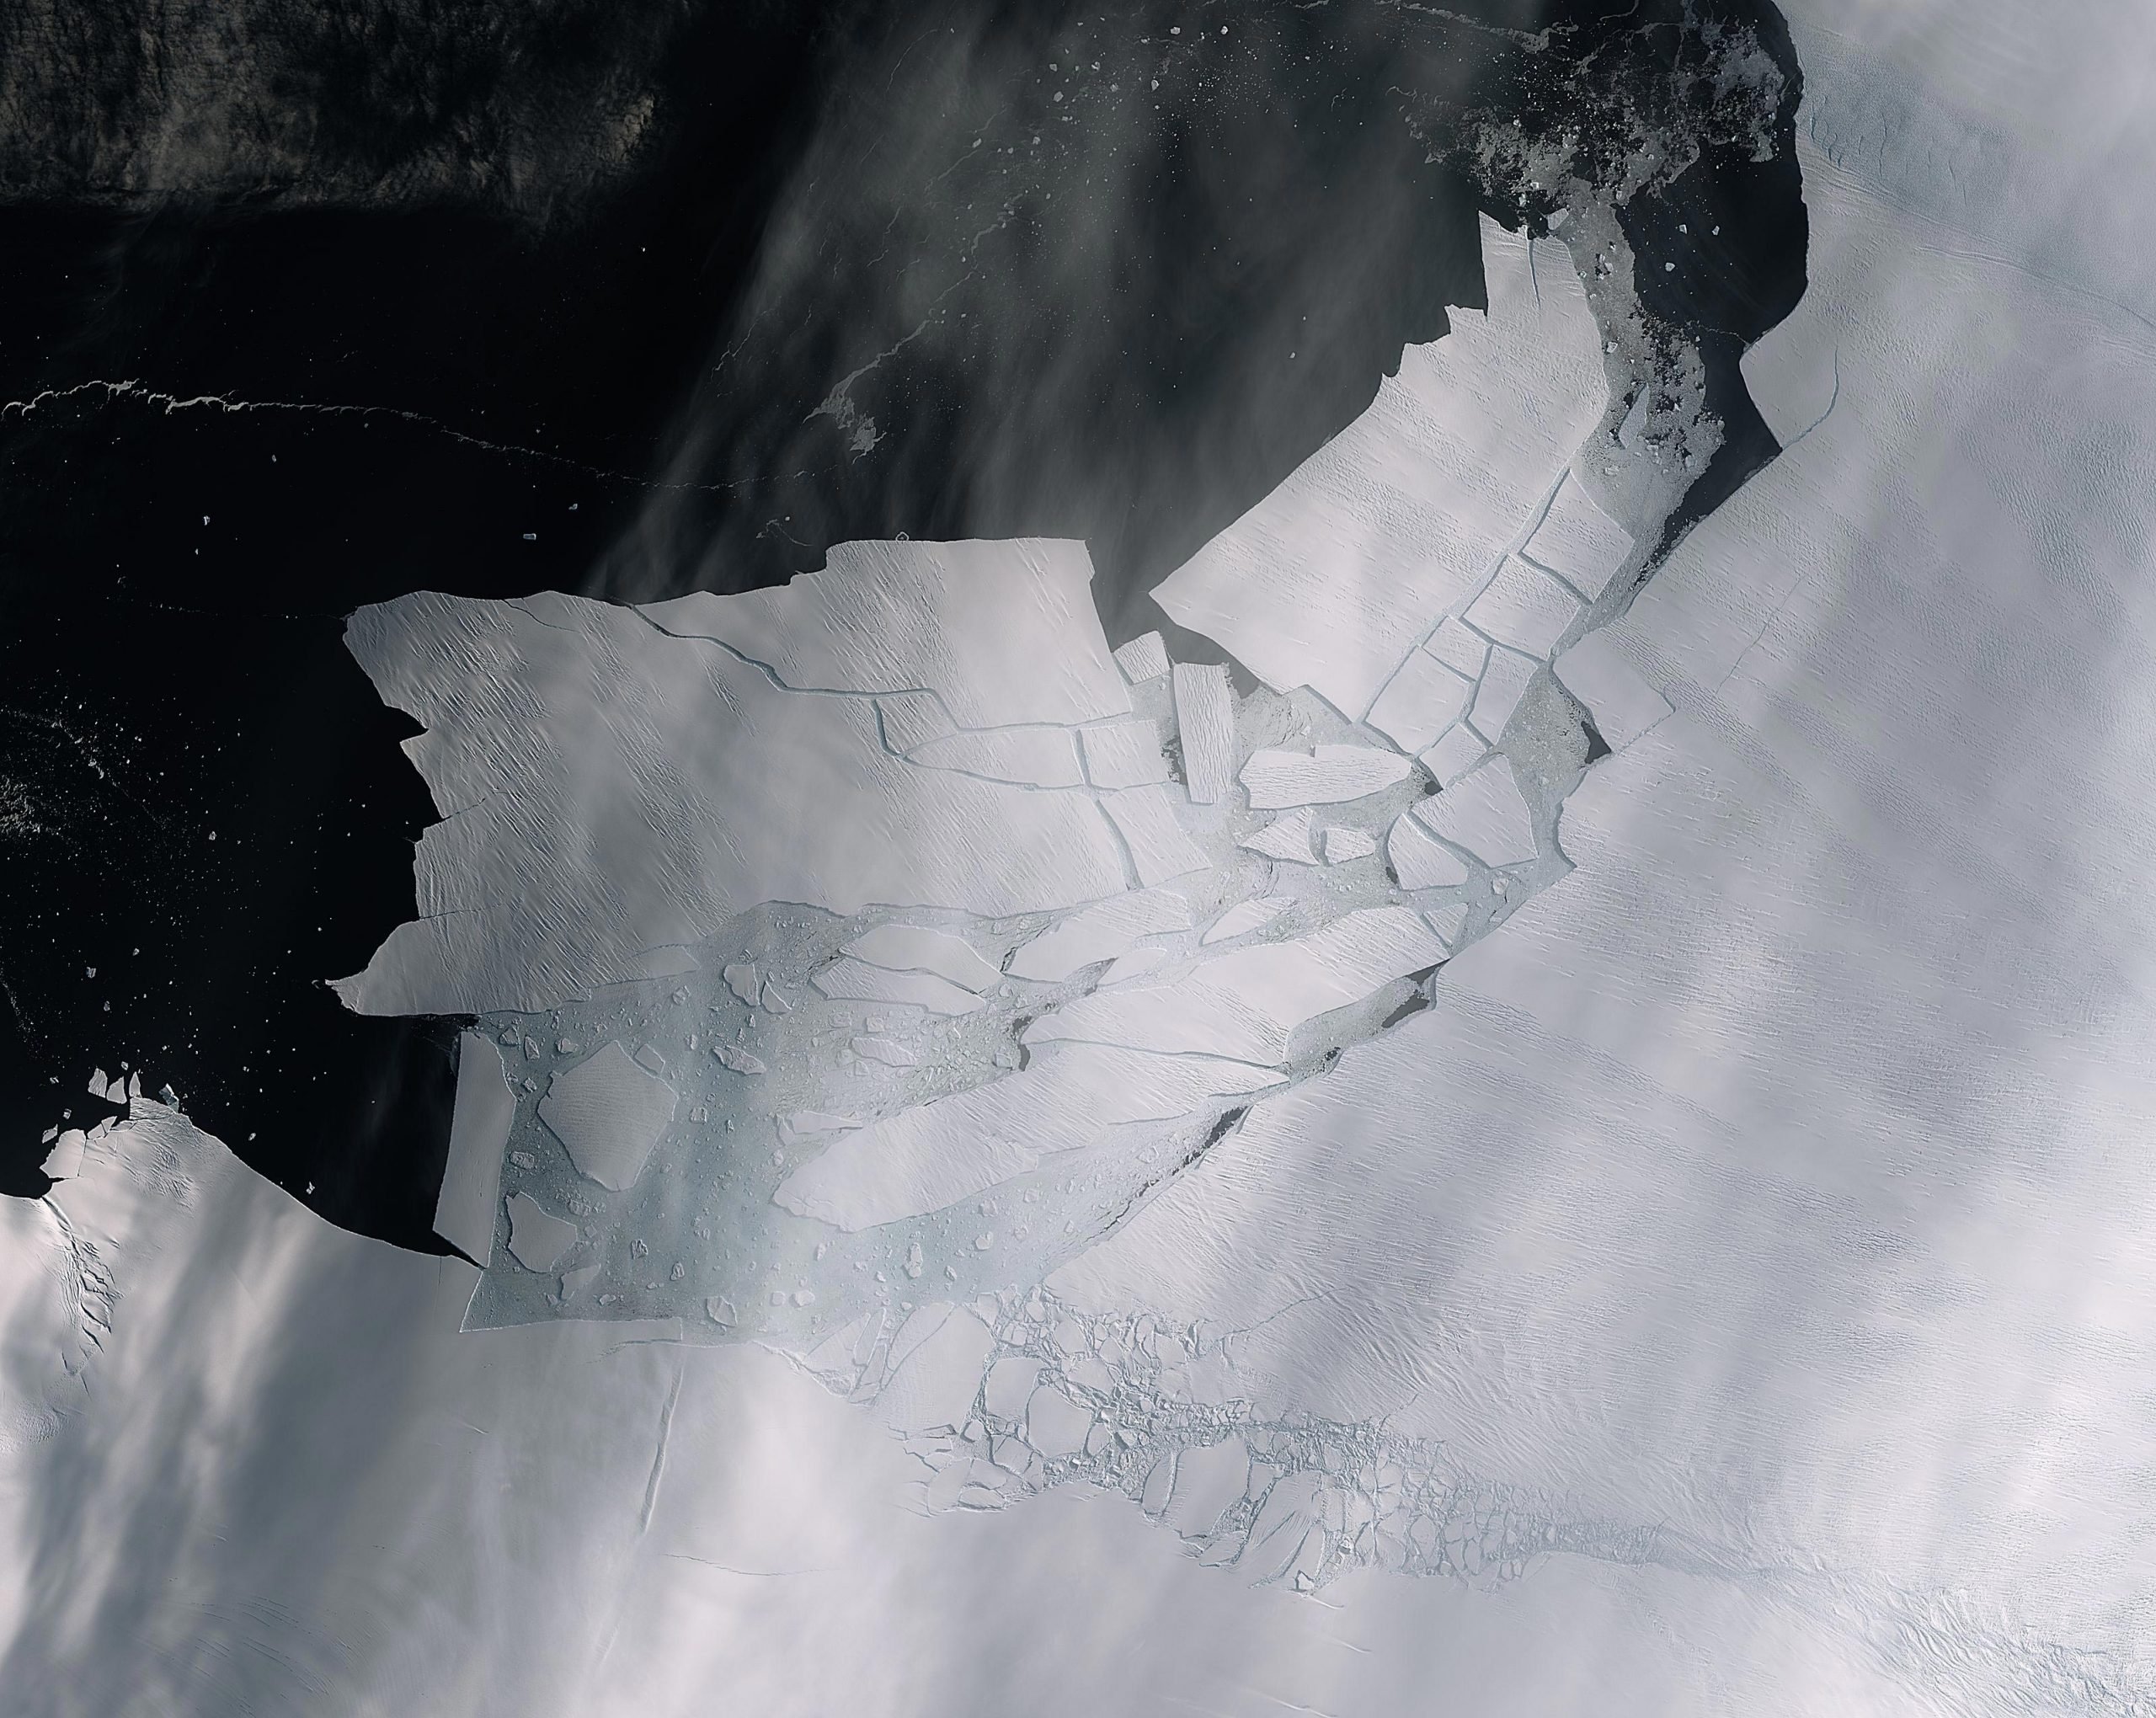
The Pine Island Glacier recently spawned an iceberg over 300 sq km (116 sq mi) that very quickly shattered into pieces. This almost cloud-free image, captured on February 11, 2020, by the Copernicus Sentinel-2 mission, shows the freshly broken bergs in detail.
A recent animation (see above) using 57 radar images captured by the Copernicus Sentinel-1 mission shows just how quickly the emerging cracks from the glacier grew – leading to this historic calving event.
Thanks to the combination of both optical and radar images from the Copernicus Sentinel satellite missions, growing cracks were spotted in the Pine Island Glacier last year, and since then, scientists have been keeping a close eye on how quickly the cracks were growing.
The Pine Island Glacier, along with its neighbor Thwaites glacier, connect the center of the West Antarctic Ice Sheet with the ocean, and together discharge significant quantities of ice into the ocean.
The spawning of the huge iceberg in Antarctica from Pine Island Glacier, known as PIG for short, was anticipated. At over 300 sq km, about the size of Malta, this huge berg very quickly broke into many ‘piglet’ pieces the largest of which is dubbed B-49. Thanks to images from the Copernicus Sentinel satellite missions, two large rifts in the glacier were spotted last year and scientists have been keeping a close eye on how quickly these cracks were growing. The animation above uses 57 radar images captured by the Copernicus Sentinel-1 mission between February 2019 and February 2020 (the last frame is from 10 February 2020) and shows just how quickly the emerging cracks grew and led to this calving event.
Pine Island Glacier, along with its neighbor Thwaites Glacier, connect the center of the West Antarctic Ice Sheet with the ocean – together discharging significant quantities of ice into the ocean. These two glaciers have been losing ice over the last 25 years. Owing to their extremely remote location, satellites play a critical role in measuring and monitoring Antarctic glaciology – revealing the timing and pace of glacial retreat in Antarctica. Since the early 1990s, the Pine Island Glacier’s ice velocity has increased dramatically to values which exceed 10 m (33 ft) a day. Its floating ice front, which has an average thickness of approximately 500 meters (1,640 feet), has experienced a series of calving events over the past 30 years, some of which have abruptly changed the shape and position of the ice front.
These changes have been mapped by ESA-built satellites since the 1990s, with calving events occurring in 1992, 1995, 2001, 2007, 2013, 2015, 2017, 2018, and now 2020.
Mark Drinkwater, senior scientist and cryosphere specialist remarked, “The Copernicus twin Sentinel-1 all-weather satellites have established a porthole through which the public can watch events like this unfold in remote regions around the world. What is unsettling is that the daily data stream reveals the dramatic pace at which climate is redefining the face of Antarctica.”
Never miss a breakthrough: Join the SciTechDaily newsletter.
Follow us on Google and Google News.
5 Comments
No such things as satellites in space and your story is more fraud by the pseudoscience community. Get a real job you parasites.
a real job in a coal mine ?
of course ice is melting in Anartica, it is SUMMER TIME down there
so….how big is Manhattan? What an idiotic form of measurement published by idiots.
Why are the only commenters here acting completely oblivious to the obvious? Remarkably important news piece. Since many people in the Western world have been to Manhattan it seems a great measurement by which to understand the scale of calving down South.