Several instruments and spacecraft from NASA’s Jet Propulsion Laboratory in Pasadena, California, have eyes on Hurricane Dorian, capturing different types of data from the storm.
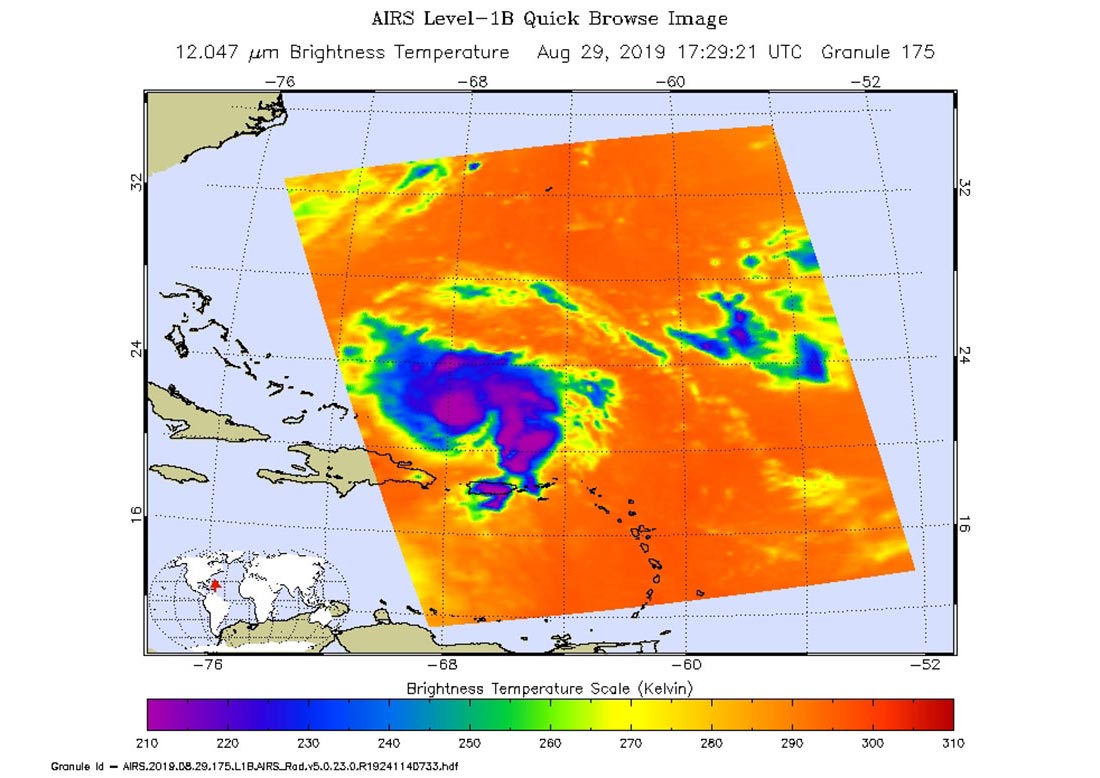
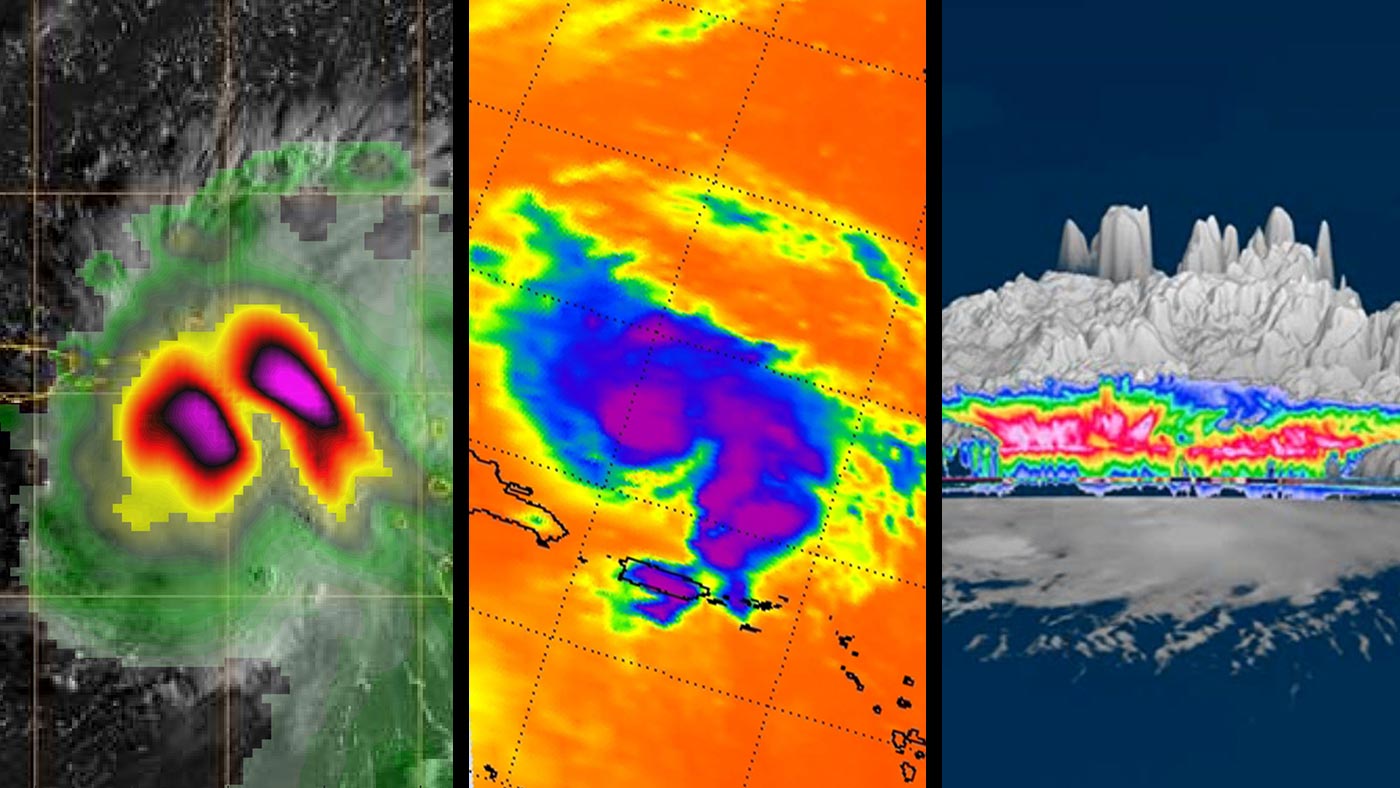
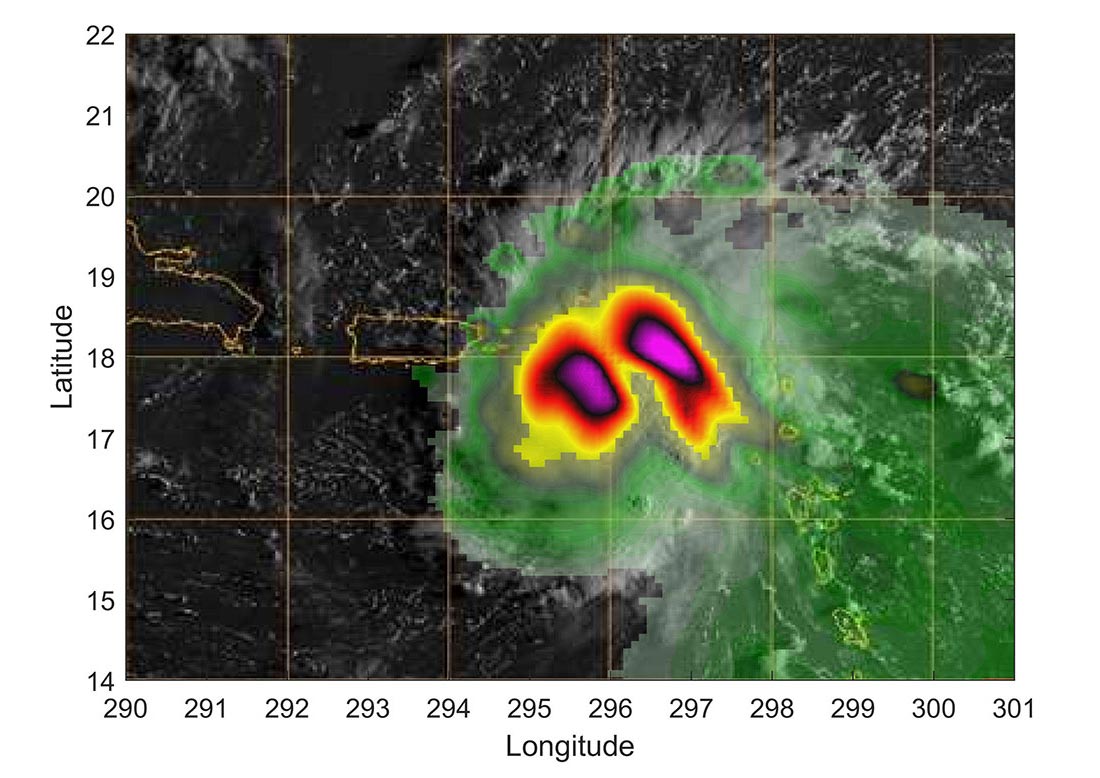
NASA’s Atmospheric Infrared Sounder (AIRS), aboard the Aqua satellite, senses emitted infrared and microwave radiation from Earth. The information is used to map such atmospheric phenomena as temperature, humidity, and cloud amounts and heights. In the AIRS imagery of Dorian, captured during the afternoon (local time) of August 29, 2019, the large purple area indicates very cold clouds carried high into the atmosphere by deep thunderstorms. These clouds are also associated with heavy rainfall. Blue and green indicate warmer areas with shallower rain clouds, while the orange and red areas represent mostly cloud-free air.
In the second image, TEMPEST-D — a weather-observing satellite the size of a cereal box — captured imagery of Hurricane Dorian off the coast of Puerto Rico in the early morning hours (local time) of August 28, 2019. At a vantage point 250 miles (400 kilometers) above the storm, the CubeSat used its miniaturized radio-wave-based instrument to see through the clouds, revealing areas with heavy rain and moisture being pulled into the storm. The green colors show moisture spiraling into the storm’s center, and the yellow to pink colors correspond to the most intense rainfall. TEMPEST-D — short for Temporal Experiment for Storms and Tropical Systems Demonstration — is an experiment in shrinking weather satellites to a size that makes them inexpensive enough to be produced in multiples. The goal is eventual real-time storm coverage with many small satellites that can track storms around the world.
On, August 27, 2019, NASA’s CloudSat satellite passed over Dorian, still a tropical storm at the time, near Puerto Rico. CloudSat uses an advanced cloud-profiling radar that “slices” through clouds giving us the ability to see how tall they are, where the different cloud layers are, and where the heavier bands of rain are found within the storm system. The 3D animation shows Dorian when it had maximum sustained winds of 52 mph (84 kph) with some of its cloud tops extending about 9 miles (15 kilometers) into the atmosphere. The colors represent the size of water or ice droplets inside the storm — deep red and pink indicate larger droplets with areas of moderate and heavy rainfall.
NASA’s CloudSat satellite provided a 3D animation after passing over Dorian, still a tropical storm at the time, near Puerto Rico. CloudSat uses an advanced cloud-profiling radar that “slices” through clouds, enabling us to see their height, their different layers, and the areas where the heavier bands of rain are found within the storm system. The animation shows Dorian when it had maximum sustained winds of 52 mph (84 kph) with some cloud tops extending about 9 miles (15 kilometers) into the atmosphere. The colors represent the size of water or ice droplets inside the storm: Deep red and pink indicate larger droplets with areas of moderate and heavy rainfall.
NASA collects data from space, air, land, and sea to increase our understanding of our home planet, improve lives and safeguard our future.
AIRS, in conjunction with the Advanced Microwave Sounding Unit (AMSU), provides a 3D look at Earth’s weather and climate. Launched into Earth orbit in 2002, the AIRS and AMSU instruments are managed by JPL under contract to NASA. TEMPEST-D is a technology-demonstration mission led by Colorado State University and managed by JPL in partnership with Blue Canyon Technologies and Wallops Flight Facility in Virginia. The mission is sponsored by NASA’s Earth Ventures program and managed by the Earth Science Technology Office. The radiometer instrument was built by JPL and employs high-frequency microwave amplifier technology developed by Northrop Grumman. CloudSat is also managed by JPL, which developed the radar instrument, with hardware contributions from the Canadian Space Agency. Colorado State University provides scientific leadership and science data processing and distribution.
Never miss a breakthrough: Join the SciTechDaily newsletter.
Follow us on Google and Google News.