
NASA mapped the Sun’s chromosphere magnetism, unlocking secrets of solar storms.
For decades after its discovery, observers could only see the solar chromosphere for a few fleeting moments: during a total solar eclipse, when a bright red glow ringed the Moon’s silhouette.
More than a hundred years later, the chromosphere remains the most mysterious of the Sun’s atmospheric layers. Sandwiched between the bright surface and the ethereal solar corona, the Sun’s outer atmosphere, the chromosphere is a place of rapid change, where temperature rises and magnetic fields begin to dominate the Sun’s behavior.
NASA’s Triple Mission Breakthrough
Now, for the first time, a triad of NASA missions have peered into the chromosphere to return multi-height measurements of its magnetic field. The observations – captured by two satellites and the Chromospheric Layer Spectropolarimeter 2, or CLASP2 mission, aboard a small suborbital rocket – help reveal how magnetic fields on the Sun’s surface give rise to the brilliant eruptions in its outer atmosphere. The paper was published on February 19, 2021, in Science Advances.
A major goal of heliophysics – the science of the Sun’s influence on space, including planetary atmospheres – is to predict space weather, which often begins on the Sun but can rapidly spread through space to cause disruptions near Earth.
Driving these solar eruptions is the Sun’s magnetic field, the invisible lines of force stretching from the solar surface to space well past Earth. This magnetic field is difficult to see – it can only be observed indirectly, by light from the plasma, or super-heated gas, that traces out its lines like car headlights traveling a distant highway. Yet how those magnetic lines arrange themselves – whether slack and straight or tight and tangled – makes all the difference between a quiet Sun and a solar eruption.
“The Sun is both beautiful and mysterious, with constant activity triggered by its magnetic fields,” said Ryohko Ishikawa, solar physicist at the National Astronomical Observatory of Japan in Tokyo and lead author of the paper.

Ideally, researchers could read out the magnetic field lines in the corona, where solar eruptions take place, but the plasma is way too sparse for accurate readings. (The corona is far less than a billionth as dense as air at sea level.)
Instead, scientists measure the more densely packed photosphere – the Sun’s visible surface – two layers below. They then use mathematical models to propagate that field upwards into the corona. This approach skips measuring the chromosphere, which lies between the two, instead, hoping to simulate its behavior.
The Chaotic Chromosphere Challenge
Unfortunately, the chromosphere has turned out to be a wildcard, where magnetic field lines rearrange in ways that are hard to anticipate. The models struggle to capture this complexity.
“The chromosphere is a hot, hot mess,” said Laurel Rachmeler, former NASA project scientist for CLASP2, now at the National Oceanic and Atmospheric Administration, or NOAA. “We make simplifying assumptions of the physics in the photosphere, and separate assumptions in the corona. But in the chromosphere, most of those assumptions break down.”
Institutions in the U.S., Japan, Spain, and France worked together to develop a novel approach to measure the chromosphere’s magnetic field despite its messiness. Modifying an instrument that flew in 2015, they mounted their solar observatory on a sounding rocket, so named for the nautical term “to sound” meaning to measure. Sounding rockets launch into space for brief, few-minute observations before falling back to Earth. More affordable and quicker to build and fly than larger satellite missions, they’re also an ideal stage to test out new ideas and innovative techniques.
Launching from the White Sands Missile Range in New Mexico, the rocket shot to an altitude of 170 miles (274 kilometers) for a view of the Sun from above Earth’s atmosphere, which otherwise blocks certain wavelengths of light. They set their sights on a plage, the edge of an “active region” on the Sun where the magnetic field strength was strong, ideal for their sensors.
As CLASP2 peered at the Sun, NASA’s Interface Region Imaging Spectrograph or IRIS and the JAXA/NASA Hinode satellite, both watching the Sun from Earth orbit, adjusted their telescopes to look at the same location. In coordination, the three missions focused on the same part of the Sun, but peered to different depths.
MEASURING MAGNETIC FIELDS
To measure magnetic field strength, the team took advantage of the Zeeman effect, a century-old technique. (The first application of the Zeeman effect to the Sun, by astronomer George Ellery Hale in 1908, is how we learned that the Sun was magnetic.) The Zeeman effect refers to the fact that spectral lines, in the presence of strong magnetic fields, splinter into multiples. The farther apart they split, the stronger the magnetic field.
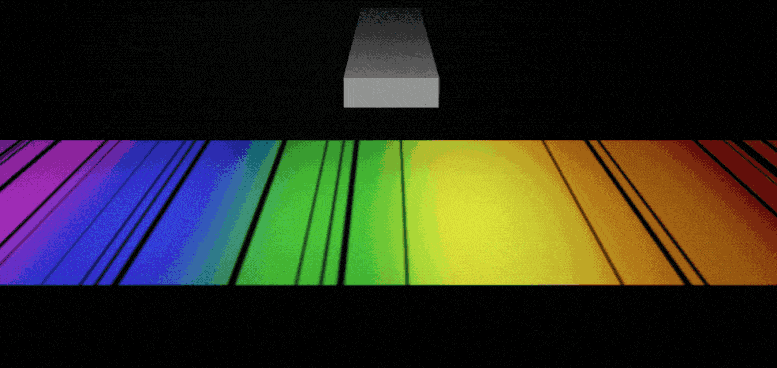
The chaotic chromosphere, however, tends to “smear” spectral lines, making it difficult to tell just how far apart they split – that’s why previous missions had trouble measuring it. CLASP2’s novelty was in working around this limitation by measuring “circular polarization,” a subtle shift in the light’s orientation that happens as part of the Zeeman effect. By carefully measuring the degree of circular polarization, the CLASP2 team could discern how far apart those smeared lines must have split, and thereby how strong the magnetic field was.
Hinode focused on the photosphere, looking for spectral lines from neutral iron formed there. CLASP2 targeted three different heights within the chromosphere, locking onto spectral lines from ionized magnesium and manganese. Meanwhile, IRIS measured the magnesium lines in higher resolution, to calibrate the CLASP2 data. Together, the missions monitored four different layers within and surrounding the chromosphere.
Eventually, the results were in: The first multi-height map of the chromosphere’s magnetic field.
“When Ryohko first showed me these results, I just couldn’t stay in my seat,” said David McKenzie, CLASP2 principal investigator at NASA’s Marshall Space Flight Center in Huntsville, Alabama. “I know it sounds esoteric – but you’ve just shown the magnetic field at four heights at the same time. Nobody does that!”
Unexpected Magnetic Variation
The most striking aspect of the data was just how varied the chromosphere turned out to be. Both along the portion of the Sun they studied and at different heights within it, the magnetic field varied significantly.
“At the Sun’s surface we see magnetic fields changing over short distances; higher up those variations are much more smeared out. In some places, the magnetic field didn’t reach all the way up to the highest point we measured whereas in other places, it was still at full strength.”
The team hopes to use this technique for multi-height magnetic measurements to map the entire chromosphere’s magnetic field. Not only would this help with our ability to predict space weather, it will tell us key information about the atmosphere around our star.
“I’m a coronal physicist – I’m really interested in the magnetic fields up there,” Rachmeler said. “Being able to raise our measurement boundary to the top of the chromosphere would help us understand so much more, help us predict so much more – it would be a huge step forward in solar physics.”
They’ll have a chance to take that step forward soon: A re-flight of the mission was just greenlit by NASA. Though the launch date isn’t yet set, the team plans to use the same instrument but with a new technique to measure a much broader swath of the Sun.
“Instead of just measuring the magnetic fields along the very narrow strip, we want to scan it across the target and make a two-dimensional map,” McKenzie said.
Read Unprecedented Map of the Sun’s Magnetic Field Created by CLASP2 Space Experiment for more on this research.
Reference: “Mapping Solar Magnetic Fields from the Photosphere to the Base of the Corona” by Ryohko Ishikawa, Javier Trujillo Bueno, Tanausú del Pino Alemán, Takenori J. Okamoto, David E. McKenzie, Frédéric Auchère, Ryouhei Kano, Donguk Song, Masaki Yoshida, Laurel A. Rachmeler, Ken Kobayashi, Hirohisa Hara, Masahito Kubo, Noriyuki Narukage, Taro Sakao, Toshifumi Shimizu, Yoshinori Suematsu, Christian Bethge, Bart De Pontieu, Alberto Sainz Dalda, Genevieve D. Vigil, Amy Winebarger, Ernest Alsina Ballester, Luca Belluzzi, Jiri Stepan, Andrés Asensio Ramos, Mats Carlsson and Jorrit Leenaarts, 19 February 2021, Science Advances.
DOI: 10.1126/sciadv.abe8406
Never miss a breakthrough: Join the SciTechDaily newsletter.
Follow us on Google and Google News.
1 Comment
Give me more information about the sun