A study has shown that atmospheric rivers, bands of water vapor intensified by climate change, can be ranked on a new intensity scale, similar to hurricanes. The research mapped global patterns of these events over 40 years, identifying hotspots for the most intense atmospheric rivers. The findings will aid meteorologists and city planners in predicting and preparing for these potentially damaging weather events.
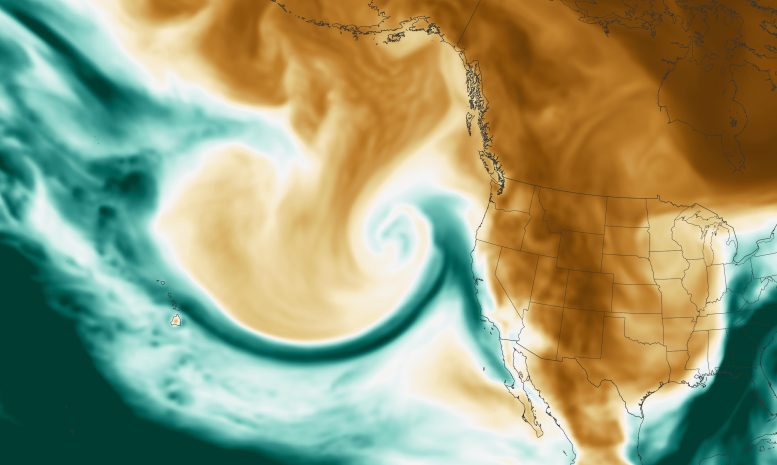
Atmospheric rivers, which are long, narrow bands of water vapor, are becoming more intense and frequent with climate change. A new study demonstrates that a recently developed scale for atmospheric river intensity (akin to the hurricane scale) can be used to rank atmospheric rivers and identify hotspots of the most intense atmospheric rivers not only along the U.S. West Coast but also worldwide.
Atmospheric rivers typically form when warm temperatures create moist packets of air, which strong winds then transport across the ocean; some make landfall. The intensity scale ranks these atmospheric rivers from AR-1 to AR-5 (with AR-5 being the most intense) based on how long they last and how much moisture they transport.
In part because some West Coast weather outlets are using the intensity scale, “atmospheric river” is no longer an obscure meteorological term but brings sharply to mind unending rain and dangerous flooding, the authors said. The string of atmospheric rivers that hit California in December and January, for instance, at times reached AR-4. Earlier in 2022, the atmospheric river that contributed to disastrous flooding in Pakistan was an AR-5, the most damaging, most intense atmospheric river rating.

The Double-Edged Sword of Atmospheric Rivers
The scale helps communities know whether an atmospheric river will bring benefit or cause chaos: The storms can deliver much-needed rain or snow, but if they’re too intense, they can cause flooding, landslides, and power outages, as California and Pakistan experienced. The most severe atmospheric rivers can cause hundreds of millions of dollars of damage in days in the western U.S.; damage in other regions has yet to be comprehensively assessed.
“Atmospheric rivers are the hurricanes of the West Coast when it comes to the public’s situational awareness,” said F. Martin Ralph, an atmospheric scientist at Scripps Institution of Oceanography at UC San Diego and a co-author on the new study. People need to know when they’re coming, have a sense for how extreme the storm will be, and know how to prepare, he said. “This scale is designed to help answer all those questions.”
Ralph and his colleagues originally developed the scale for the U.S. West Coast. The new study demonstrates that atmospheric river events can be directly compared globally using the intensity scale, which is how the researchers identified where the most intense events (AR-5) form and fizzle out, and how many of those make landfall.
The researchers used climate data and their previously developed algorithm for identifying and tracking atmospheric rivers to build a database of intensity-ranked atmospheric river events around the globe over 40 years (1979/1980 to 2019/2020). The study was published in the Journal of Geophysical Research: Atmospheres, which publishes research that advances understanding of Earth’s atmosphere and its interaction with other components of the Earth system.
“This study is a first step toward making the atmospheric river scale a globally useful tool for meteorologists and city planners,” said Bin Guan, an atmospheric scientist at the Joint Institute for Regional Earth System Science and Engineering, a collaboration between the University of California-Los Angeles (UCLA) and NASA’s Jet Propulsion Laboratory (JPL), who led the study. “By mapping out the footprints of each atmospheric river rank globally, we can start to better understand the societal impacts of these events in many different regions.”
The authors also found that more intense atmospheric rivers (AR-4 and AR-5) are less common than weaker events, with AR-5 events occurring only once every two to three years when globally averaged. The most intense atmospheric rivers are also less likely to make landfall, and when they do, they are unlikely to maintain their strength for long and penetrate farther inland. “They tend to dissipate soon after landfall, leaving their impacts most felt in coastal areas,” said Guan.
The study found four “centers,” or hotspots, of where AR-5s tend to die, in the extratropical North Pacific and Atlantic, Southeast Pacific, and Southeast Atlantic. Cities on the coasts within these hotspots, such as San Francisco and Lisbon, are most likely to see intense AR-5s make landfall. Midlatitudes in general are the most likely regions to have atmospheric rivers of any rank.
El Niño’s Role in Atmospheric River Strength
Strong El Niño years are more likely to have more atmospheric rivers, and stronger ones at that, which is noteworthy because NOAA recently forecasted that an El Niño condition is likely to develop by the end of the summer this year.
While local meteorologists, news outlets, and other West Coasters may have incorporated “atmospheric river” and the intensity scale into their lives, adoption has been slower elsewhere, Ralph said. He hopes to see, within five years or so, meteorologists on TV around the world incorporating the atmospheric river intensity scale into their forecasts, telling people whether the atmospheric river will be beneficial or if they need to prepare for a serious storm.
Reference: “Global Application of the Atmospheric River Scale” by Bin Guan, Duane E. Waliser and F. Martin Ralph, 18 January 2023, Journal of Geophysical Research: Atmospheres.
DOI: 10.1029/2022JD037180
Never miss a breakthrough: Join the SciTechDaily newsletter.
Follow us on Google and Google News.
2 Comments
I guess it’s marginally more useful than the old scale, “rain” and “a lot of rain”, but not versus the old way of measuring how much rain. Of course it’s climate change that causes rain, but they will have to increase the scale to account for gun control sales increases, as it’s been atmospheric rivering AR-1 Parasnipers, AR-5 long rifles, AR-7 survival rifles, AR-10 battle rifles, and when they start getting AR-15 and AR-18 California’s drought will be over but ArmaLite might sue.
“Atmospheric rivers, which are long, narrow bands of water vapor, are becoming more INTENSE and FREQUENT with climate change.”
The above is in the article from the AGU press release. However, interestingly, the original research paper, available at the link provided, does NOT mention “climate change” EVEN ONCE! It appears that someone is editorializing without the benefit of evidence to support the assertion. This isn’t new, but it usually isn’t so blatant. I have looked at the graphs in Fig. 5 in the original article. There appears to be a slight increase in the frequency of AR 2 through AR 4 oceanic events over the last 15 years. However, the same cannot be said for over land.
Considering that what were formerly called a “Pineapple Express” have been happening since at least 1862 [ https://en.wikipedia.org/wiki/Great_Flood_of_1862 ] 40 years is probably not sufficient time to declare an increase in frequency or intensity, let alone to attribute a cause. I personally remember the failure of the Hell Hole Dam on the Rubicon River in December 1964, the result of almost constant rain that started just about the time of the academic Christmas Break, and continued into 1965. It was a major AR with bridges and roads washed out throughout the Klamath Mountains and even farther north.
Why can’t we just get the facts, without the inaccurate editorializing?