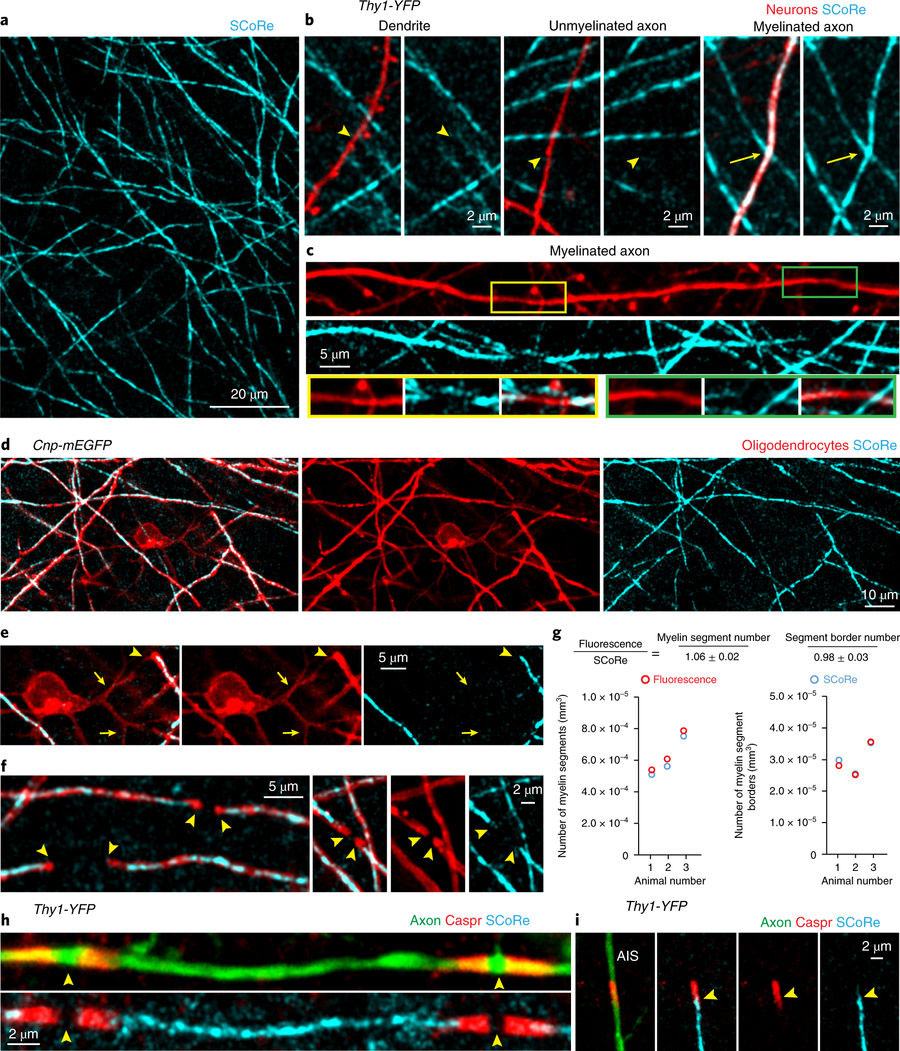
Fig. 1: SCoRe microscopy for label-free myelin imaging. a, In vivo image using SCoRe microscopy, captured from layer I of the mouse somatosensory cortex, showing single myelin internodes. b, In vivo images captured from a transgenic mouse with sparse YFP fluorescent protein labeling in a subset of neurons (Thy1-YFP) showing nonreflective fluorescently labeled dendrites and unmyelinated axons (arrowheads) and a myelinated reflective axon (arrows). c, In vivo image showing unmyelinated gaps (boxes and green- and yellow- outlined insets, respectively) along a regularly myelinated axon, further showing the specificity of the SCoRe imaging technique. d, In vivo image captured from a transgenic mouse with membrane-tethered EGFP (mEGFP) expressed specifically in myelinating oligodendrocytes (Cnp-mEGFP) showing complete overlap between fluorescently labeled myelinating internodes and SCoRe. e, In vivo image showing a single oligodendrocyte cell body with proximal, nonmyelinating processes extending from the soma (arrows) and then forming a myelin sheath revealed by the co-localization of the fluorescent and SCoRe signal (arrowheads). f, The borders of single internodes are indicated (arrowheads), demonstrating the specificity and overlap between oligodendrocyte-specific mEGFP and SCoRe. g, Quantification of myelin segments (left) and myelin segment borders (right) detected using either CNP-mEGFP fluorescence (red) or SCoRe (cyan) signals, demonstrating similar detection levels of both myelin segments and the borders of single internodes using either the fluorescent label or SCoRe (159 SCoRe segments, 169 mEGFP segments, 856 SCoRe segment borders, 842 mEGFP segment borders, from n = 3 mice) See Supplementary Fig. 2 for further example quantification. h, Image of fixed immunolabeled cortical tissue showing a single internode with localization of the paranodal protein Caspr bordering two nodes of Ranvier (arrowheads) and the SCoRe signal arising only from the myelin internode. i, The precise start of SCoRe signal at the edge of the axon initial segment (AIS) adjacent to the Caspr labeling (arrowheads), again showing the precise specificity of the SCoRe signal for myelin. Each image is representative of at least three locations in at least three animals. Nature Neuroscience (2018) doi:10.1038/s41593-018-0120-6
Myelin acts as insulation for millions of brain cells, allowing for swift and efficient transmission of signals across brain regions. Despite its crucial role, little is known about how stable this structure is in the adult brain and what impact aging has on its maintenance.
Yale neurologists Robert Hill, Alice Li, and Jaime Grutzendler devised techniques to track and precisely image myelin throughout the lifetime of the mouse. They discovered that myelin continues to form and restructure in the adult brain — indicating the potential for lifelong change. They also learned that during aging, myelin begins to deteriorate and myelin debris accumulate over time.
“Myelin is not static in the adult brain and may play an underappreciated role in brain plasticity, a role that is likely to be disrupted as we age,” Hill said. The findings were published March 19 in the journal Nature Neuroscience.
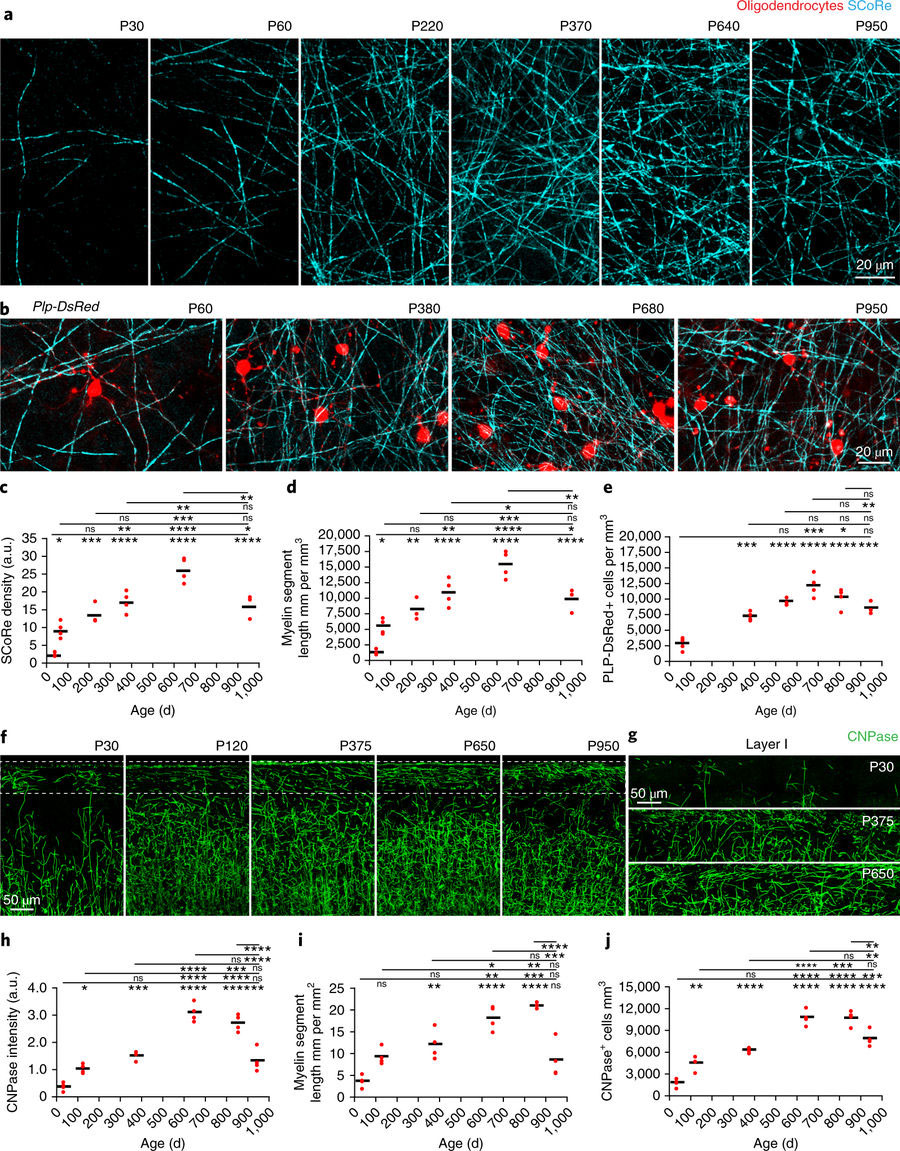
Fig. 2: Lifelong changes in cortical myelin and oligodendrocyte density. a, SCoRe images captured in vivo at the indicated ages show marked, age-dependent changes in myelin density in layer I of the somatosensory cortex. b, In vivo images captured from transgenic mice with DsRed fluorescent protein expressed specifically in mature oligodendrocytes (Plp-DsRed) demonstrate age-dependent changes in oligodendrocyte density corresponding to the changes observed in SCoRe signals. c, Average SCoRe reflection density obtained from imaging large regions of interest in vivo at the indicated ages show significant increases in reflective signals until P640, followed by a marked decline as the mice age (one-way ANOVA with Tukey correction for multiple comparisons; n = 3 or 4 mice per age). d, A measurement of myelination length per unit volume derived from SCoRe images at the indicated ages shows a gradual increase in the total myelin segment length per area until P640, followed by a decline in aging (one-way ANOVA with Tukey correction for multiple comparisons, n = 3 or 4 mice per age). e, Oligodendrocyte imaging (Plp-DsRed+ cells) at the indicated ages showed significant increases in oligodendrocyte density until P640, followed by a decrease as the mice age (one-way ANOVA with Tukey correction for multiple comparisons, n = 3–6 mice per age). f,g, Images of oligodendrocyte-specific CNPase staining captured from the somatosensory cortex, showing age-dependent changes in layer I (boxed regions) of the cortex (additional examples of layer I expanded in g). h, CNPase staining density at the indicated ages showing significant increases in fluorescence signal until P650, followed by a marked decline in aging (one-way ANOVA with Tukey correction for multiple comparisons; n = 4 mice per age; each red dot indicates one mouse). i, CNPase process length per volume at the indicated ages, showing significant increases in the total myelin segment length until P650 (one-way ANOVA with Tukey correction for multiple comparisons, n = 4 mice per age). j, CNPase+ oligodendrocyte density at the indicated ages, showing significant increases in oligodendrocyte density until P650, with a significant decline in aging (one-way ANOVA with Tukey correction for multiple comparisons, n = 4 mice per age). In all graphs each red dot indicates one mouse and the horizontal line indicates the mean; ns, not significant; *P < 0.05, **P < 0.01, ***P < 0.001, ****P < 0.0001. Descriptive statistics can be found in Supplementary Table 1. Each image is representative of at least three locations in at least three animals. Nature Neuroscience (2018) doi:10.1038/s41593-018-0120-6
Reference: “Lifelong cortical myelin plasticity and age-related degeneration in the live mammalian brain” by Robert A. Hill, Alice M. Li and Jaime Grutzendle, 19 March 2018, Nature Neuroscience. DOI: 10.1038/s41593-018-0120-6