
Compelling Hard Evidence: El Nino Swings More Violently in the Industrial Age
El Ninos have become more intense in the industrial age, which stands to worsen storms, drought, and coral bleaching in El Nino years. A new study has found compelling evidence in the Pacific Ocean that the stronger El Ninos are part of a climate pattern that is new and strange.
It is the first known time that enough physical evidence spanning millennia has come together to allow researchers to say definitively that: El Ninos, La Ninas, and the climate phenomenon that drives them have become more extreme in the times of human-induced climate change.
“What we’re seeing in the last 50 years is outside any natural variability. It leaps off the baseline. Actually, we even see this for the entire period of the industrial age,” said Kim Cobb, the study’s principal investigator and professor in the Georgia Institute of Technology’s School of Earth and Atmospheric Sciences. “There were three extremely strong El Nino-La Nina events in the 50-year period, but it wasn’t just these events. The entire pattern stuck out.”
The study’s first author Pam Grothe compared temperature-dependent chemical deposits from present-day corals with those of older coral records representing relevant sea surface temperatures from the past 7,000 years. With the help of collaborators from Georgia Tech and partner research institutions, Grothe identified patterns in the El Nino Southern Oscillation (ENSO), swings of heating and cooling of equatorial Pacific waters that, every few years, spur El Ninos and La Ninas respectively.
The team found the industrial age ENSO swings to be 25% stronger than in the pre-industrial records. The researchers published their results in the journal Geophysical Review Letters in October 2019. The work was funded by the National Science Foundation.
Slumbering evidence
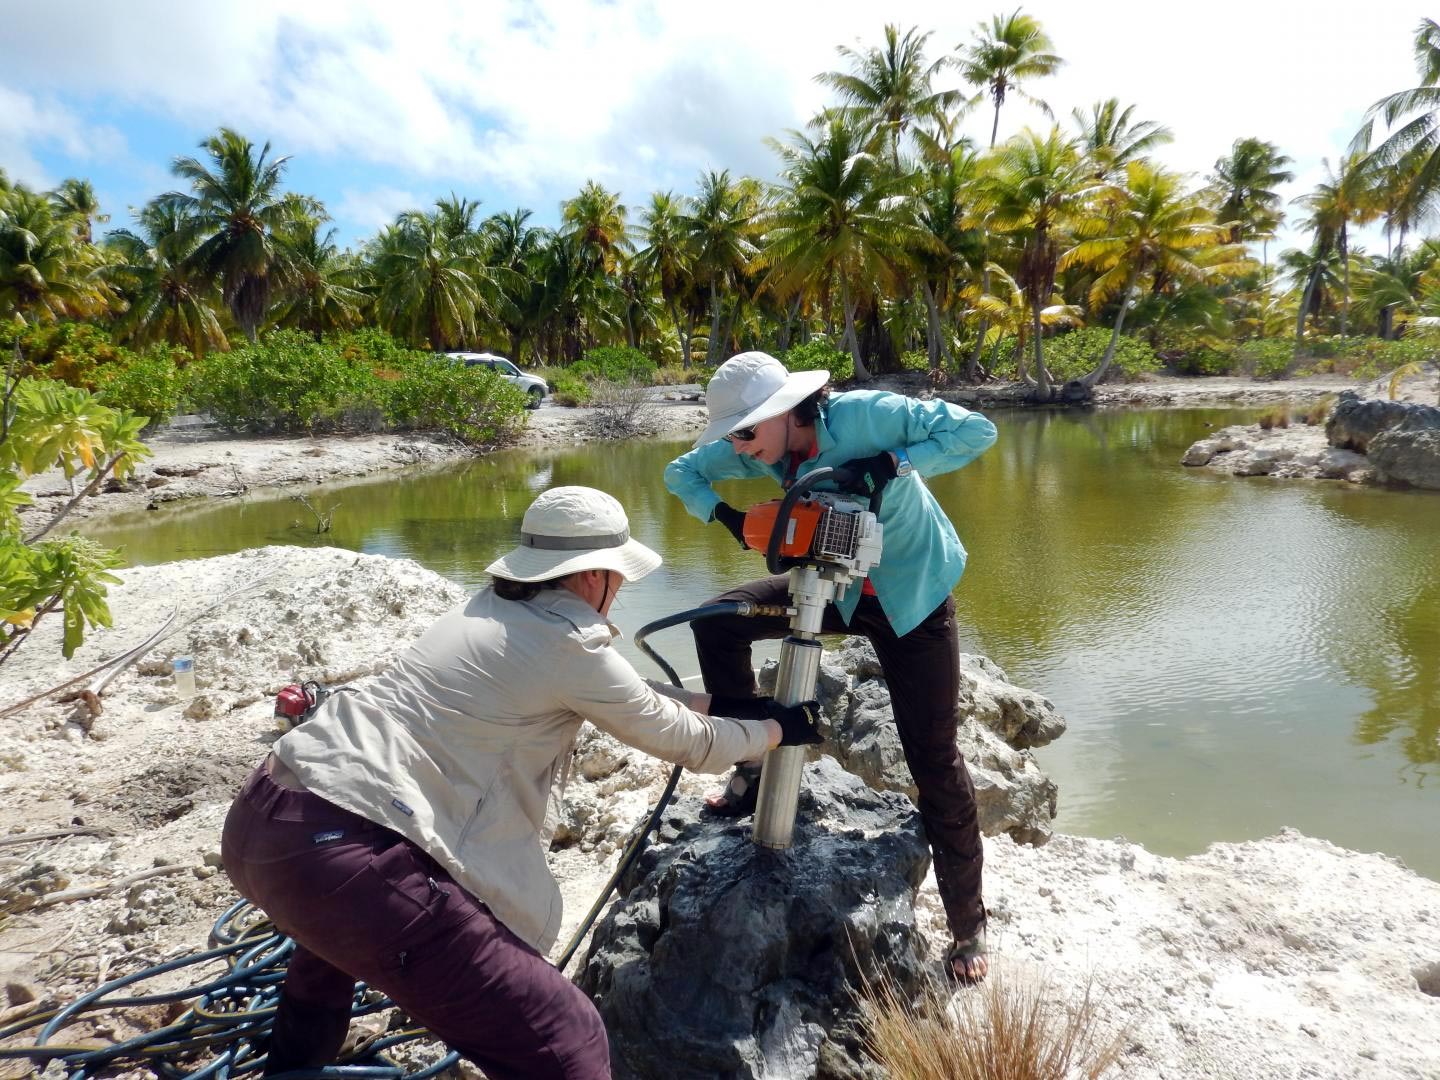
The evidence had slumbered in and around shallow Pacific waters, where ENSO and El Ninos originate until Cobb and her students plunged hollow drill bits into living coral colonies and fossil coral deposits to extract it. In more than 20 years of field expeditions, they collected cores that contained hundreds of records.
The corals’ recordings of sea surface temperatures proved to be astonishingly accurate when benchmarked. Coral records from 1981 to 2015 matched sea surface temperatures measured via satellite in the same period so exactly that, on a graph, the jagged lines of the coral record covered those of the satellite measurements, obscuring them from view.
“When I present it to people, I always get asked, ‘Where’s the temperature measurement?’ I tell them it’s there, but you can’t see it because the corals’ records of sea surface temperatures are that good,” said Grothe, a former graduate research assistant in Cobb’s lab and now an associate professor at the University of Mary Washington.
First red flag?
In 2018, enough coral data had amassed to distinguish ENSO’s recent activity from its natural preindustrial patterns.
To stress-test the data, Grothe left out chunks to see if the industrial-age ENSO signal still stuck out. She removed the record-setting 1997/1998 El Nino-La Nina and examined industrial age windows of time between 30 and 100 years long.
The signal held in all windows, but the data needed the 97/98 event to be statistically significant. This could mean that changes in the ENSO activities have just now reached a threshold that makes them detectable.
What is El Nino?
Every two to seven years in spring, an El Nino is born when the warm phase of the ENSO swells into a long heat blob in the tropical Pacific, typically peaking in early winter. It blows through oceans and air around the world, ginning up deluges, winds, heat, or cold in unusual places.
Once El Nino passes, the cycle reverses into La Nina by the following fall, when airstreams push hot water westward and dredge up frigid water in the equatorial Pacific. This triggers a different set of global weather extremes.
Tropical Pacific corals record the hot-cold oscillations by absorbing less of an oxygen isotope (O18) during ENSO’s hot phases, and progressively more of it during ENSO’s cool phases. As corals grow, they create layers of oxygen isotope records, chronicles of temperature history.
Waves, repairs, contortions
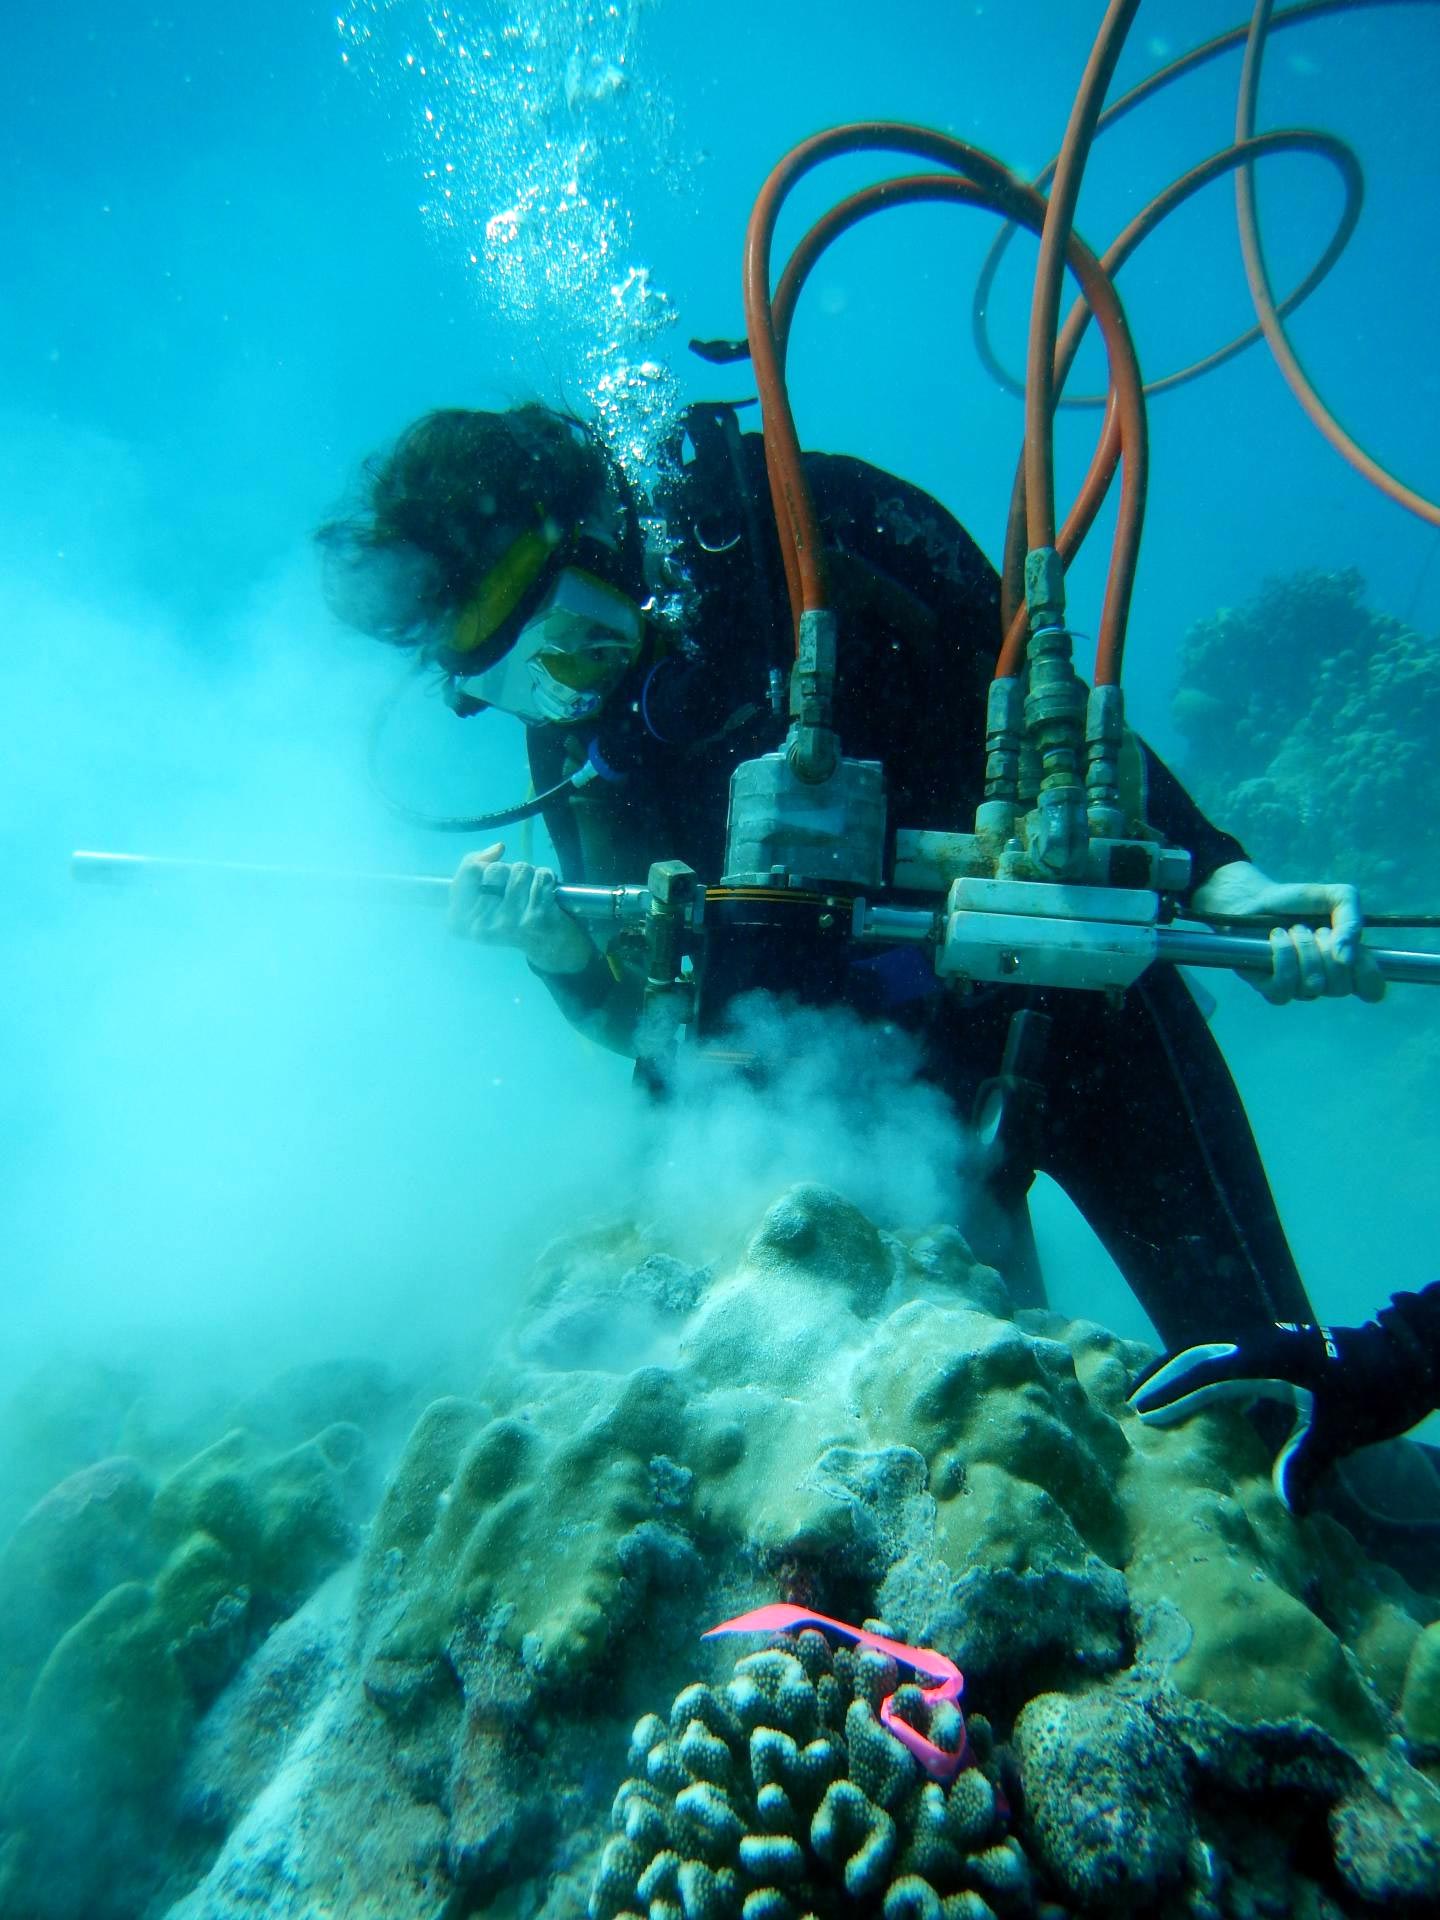
Extracting them is adventurous: A research diver guides a chest-high pneumatic drill under the ocean. Its pressure hose connects to a motor on the boat that powers the drill after the diver has taken off her fins and weighed herself down on the reef.
She carefully angles the bit down the axis of coral growth to get a core with layers that can be accurately counted back in time. On occasion, waves put her and her safety diver through washing machine cycles.
“Doing this all underwater adds an extra level of difficulty, even from the simplest tasks like working with wrenches,” Grothe said. “But the drill slices through underwater corals like butter. Fossil corals are drilled on land, and the drill constantly seizes up and overheats.”
Blowing models away
The physical proof taken from three islands that dot the heart of the ENSO zone has also thrown down scientific gauntlets, starkly challenging computer models of ENSO patterns and causes. A prime example: Previously unknown to science, the study showed that in a period from 3,000 to 5,000 years ago, the El Nino-La Nina oscillations were extremely mild.
“Maybe there’s no good explanation for a cause. Maybe it just happened,” Cobb said. “Maybe El Nino can just enter a mode and get stuck in it for a millennium.”
Reference: “Enhanced El Niño‐Southern Oscillation variability in recent decades” by Pamela R. Grothe, Kim M. Cobb, Giovanni Liguori, Emanuele Di Lorenzo, Antonietta Capotondi, Yanbin Lu, Hai Cheng, R. Lawrence Edwards, John R. Southon, Guaciara M. Santos, Daniel M. Deocampo, Jean Lynch‐Stieglitz, Tianran Chen, Hussein R. Sayani, Diane M. Thompson, Jessica L. Conroy, Andrea L. Moore, Kayla Townsend, Melat Hagos, Gemma O’Connor and Lauren T. Toth, 25 October 2019, Geophysical Review Letters.
DOI: 10.1029/2019GL083906
These researchers coauthored the study: Giovanni Liguori, Emanuele Di Lorenzo, Jean Lynch-Stieglitz, Hussein Sayani, Kayla Townsend, Melat Hagos, and Gemma O’Connor from Georgia Tech; Antonietta Capotondi from the NOAA Earth System Research Laboratory; Yanbin Lu and Lawrence Edwards from the University of Minnesota; Hai Cheng from the University of Minnesota and Xi’an Jiaotong University; John Southon and Guaciara Santos from the University of California, Irvine; Daniel Deocampo from Georgia State University; Tianran Chen from the Chinese Academy of Sciences; Diane M. Thompson from the University of Arizona; Jessica Conroy from the University of Illinois at Urbana-Champaign; Andrea Moore from the University of Mary Washington, and Lauren Toth from the U.S. Geological Survey. The research was funded by the National Science Foundation (awards 1502832, 1446343, 1029020, and 1349599), the National Science Foundation of China (award 41888101), NOAA’s Climate Program Office and the Department of Energy’s Office of Science, U.S. Geological Survey and National Science Foundation (award 1535007), and a Sigma Delta Epsilon-Graduate Women in Science fellowship. Any findings, conclusions, or recommendations are those of the authors and not necessarily shared by the funding agencies.
Never miss a breakthrough: Join the SciTechDaily newsletter.
Follow us on Google and Google News.
8 Comments
There is NO statistical correlation between the monthly 3.4 ENSO temperature anomalies and Mauna Loa atmospheric CO2 over the last 50 years. Plot the Hadcrut data.
The correlation seems obvious to me.
Yes, there is none. The ENSO is made up of three parts, a warming El-Nino, a cooling La-Nina and the in-between neutral.. El-Nada? The three over time balance out as any charts showing all three will show. Mauna Loa CO2 does not correlate with the ENSO. Plot the monthly ENSO temperature anomalies against Mauna Loa CO2 and see for yourself. At the moment, the current ENSO is “stuck” in neutral.
The study doesn’t make the connection, but readjusting models to this new data then plotting greenhouse gas emissions and modeling chains of effects might give indication of a connection or cause.
https://www.academia.edu/40968945/VEDIC_METEOROLOGY_2020_-GLOBAL_WEATHER_FORECAST
Vedic Science offers infinity scope to know weather extremes well in advance. It requires institutional support and research to achieve the ultimate.
https://www.academia.edu/40968945/VEDIC_METEOROLOGY_2020_-GLOBAL_WEATHER_FORECAST
Southpacificmarinepark.com Growing a vast free floating kelp forest eco-system between New Zealand and South America could help to stabilise these swings as well as removing gigatons of co2 from the South Pacific Ocean.
The swings are part of the seasonal natural variability that cannot, as yet, be predicted very far in advance. The kelp, of course, will be quickly recycled if not buried. Burial away from oxygen is the problem with bioenergy sequestration.