
A key finding: Early reopening last spring led to a dramatic drop in “quarantine strength” in southern and west-central U.S. states.
Some of the research described in this article has been published on a preprint server but has not yet been peer-reviewed by experts in the field.
As Covid-19 infections soar across the U.S., some states are tightening restrictions and reinstituting quarantine measures to slow the virus’ spread. A model developed by MIT researchers shows a direct link between the number of people who become infected and how effectively a state maintains its quarantine measures.
The researchers described their model in a paper published in Cell Patterns in November, showing that the system could recapitulate the effects that quarantine measures had on viral spread in countries around the world. In their next study, recently posted to the preprint server medRxiv, they drilled into data from the United States last spring and summer. That earlier surge in infections, they found, was strongly related to a drop in “quarantine strength” — a measure the team defines as the ability to keep infected individuals from infecting others.
The latest study focuses on last spring and early summer, when the southern and west-central United States saw a precipitous rise in infections as states in those regions reopened and relaxed quarantine measures. The researchers used their model to calculate the quarantine strength in these states, many of which were early to reopen following initial lockdowns in the spring.

If these states had not reopened so early, or had reopened but strictly enforced measures such as mask-wearing and social distancing, the model calculates that more than 40 percent of infections could have been avoided in all states that the researchers considered. In particular, the study estimates, if Texas and Florida had maintained stricter quarantine measures, more than 100,000 infections could have been avoided in each of those states.
“If you look at these numbers, simple actions on an individual level can lead to huge reductions in the number of infections and can massively influence the global statistics of this pandemic,” says lead author Raj Dandekar, a graduate student in MIT’s Department of Civil and Environmental Engineering.
As the country battles a winter wave of new infections, and states are once again tightening restrictions, the team hopes the model can help policymakers determine the level of quarantine measures to put in place.
“What I think we have learned quantitatively is, jumping around from hyper-quarantine to no quarantine and back to hyper-quarantine definitely doesn’t work,” says co-author Christopher Rackauckas, an applied mathematics instructor at MIT. “Instead, good consistent application of policy would have been a much more effective tool.”
The new paper’s MIT co-authors also include undergraduate Emma Wang and professor of mechanical engineering George Barbastathis.
Strength learning
The team’s model is a modification of a standard SIR model, an epidemiological model that is used to predict the way a disease spreads, based on the number of people who are either “susceptible,” “infectious,” or “recovered.” Dandekar and his colleagues enhanced an SIR model with a neural network that they trained to process real Covid-19 data.
The machine-learning-enhanced model learns to identify patterns in data of infected and recovered cases, and from these data, it calculates the number of infected individuals who are not transmitting the virus to others (presumably because the infected individuals are following some sort of quarantining measures). This value is what the researchers label as “quarantine strength,” which reflects how effective a region is in quarantining an infected individual. The model can process data over time to see how a region’s quarantine strength evolves.
The researchers developed the model in early February and have since applied it to Covid-19 data from more than 70 countries, finding that it has accurately simulated the on-the-ground quarantine situation in European, South American, and Asian countries that were initially hard-hit by the virus.
“When we look at these countries to see when quarantines were instituted, and we compare that with results for the trained quarantine strength signal, we see a very strong correlation,” Rackauckas says. “The quarantine strength in our model changes a day or two after policies are instituted, among all countries. Those results validated the model.”
The team published these country-level results last month in Cell Patterns, and are also hosting the results at covid19ml.org, where users can click on a map of the world to see how a given country’s quarantine strength has changed over time.
What if states had delayed?
Once the researchers validated the model at the country level, they applied it to individual states in the U.S., to see not only how a state’s quarantine measures evolved over time, but how the number of infections would have changed if a state modified its quarantine strength, for instance by delaying reopening.
They focused on the south and west-central U.S., where many states were early to reopen and subsequently experienced rapid surges in infections. The team used the model to calculate the quarantine strength for Arizona, Florida, Louisiana, Nevada, Oklahoma, South Carolina, Tennessee, Texas, and Utah, all of which opened before May 15. They also modeled New York, New Jersey, and Illinois — states that delayed reopening to late May and early June.
They fed the model the number of infected and recovered individuals that was reported for each state, starting from when the 500th infection was reported in each state, up until mid-July. They also noted the day on which each state’s stay-at-home order was lifted, effectively signaling the state’s reopening.
For every state, the quarantine strength declined soon after reopening; the steepness of this decline, and the subsequent rise in infections, was strongly related to a state’s reopening. States that reopened early on, such as South Carolina and Tennessee, had a steeper drop in quarantine strength and a higher rate of daily cases.
“Instead of just saying that reopening early is bad, we are actually quantifying here how bad it was,” Dandekar says.
Meanwhile, states like New York and New Jersey, which delayed reopening or enforced quarantine measures such as mask-wearing even after reopening, kept a more or less steady quarantine strength, with no significant rise in infections.
“Now that we can give a measure of quarantine strength that matches reality, we can say, ‘What if we kept everything constant? How much difference would the southern states have had in their outlook?’” Rackauckas says.
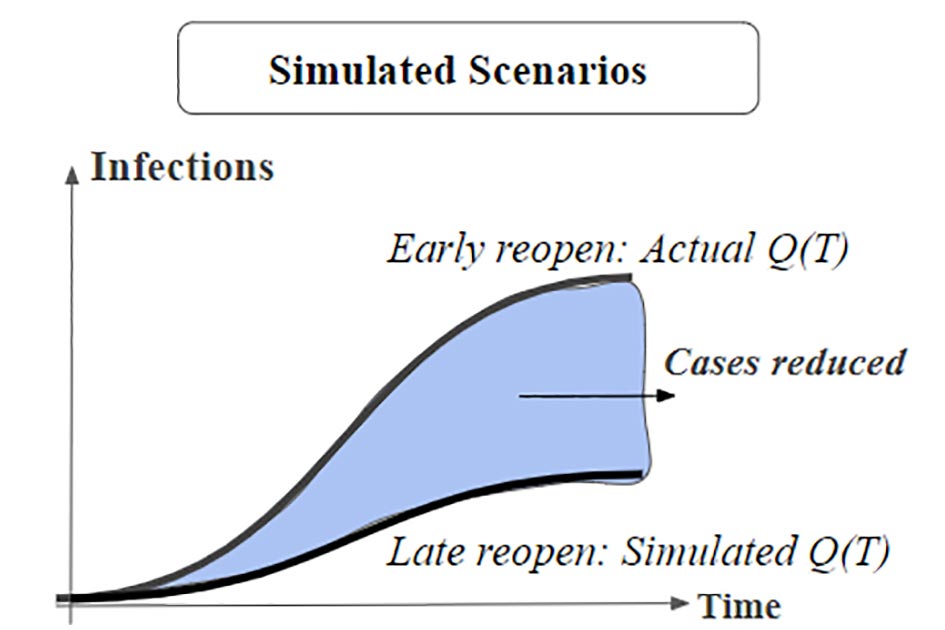
Next, the team reversed its model to estimate the number of infections that would have occurred if a given state maintained a steady quarantine strength even after reopening. In this scenario, more than 40 percent of infections could have been avoided in each state they modeled. In Texas and Florida, that percentage amounts to about 100,000 preventable cases for each state.
Conceivably, as the pandemic continues to ebb and surge, policymakers could use the model to calculate the quarantine strength needed to keep a state’s current infections below a certain number. They could then look through the data to a point in time where the state exhibited this same value, and refer to the type of restrictions that were in place at that time, as a guide to the policies they could put in place at the present time.
“What is the rate of growth of the disease that we’re comfortable with, and what would be the quarantine policies that would get us there?” Rackauckas says. “Is it everyone holing up in their houses, or is it everyone allowed to go to restaurants, but once a week? That’s what the model can kind of tell us. It can give us more of a refined quantitative view of that question.”
References:
“A Machine Learning-Aided Global Diagnostic and Comparative Tool to Assess Effect of Quarantine Control in COVID-19 Spread” by Raj Dandekar, Chris Rackauckas and George Barbastathis, 17 November 2020, Cell Patterns.
DOI: 10.1016/j.patter.2020.100145
“Implications of delayed reopening in controlling the COVID-19 surge in Southern and West-Central USA” by Raj Dandekar, Emma Wang, George Barbastathis and Chris Rackauckas, 3 December 2020, MedRxiv.
DOI: 10.1101/2020.12.01.20242172
This research was funded, in part, by the Intelligence Advanced Research (Projects Activity (IARPA).
Never miss a breakthrough: Join the SciTechDaily newsletter.
Follow us on Google and Google News.