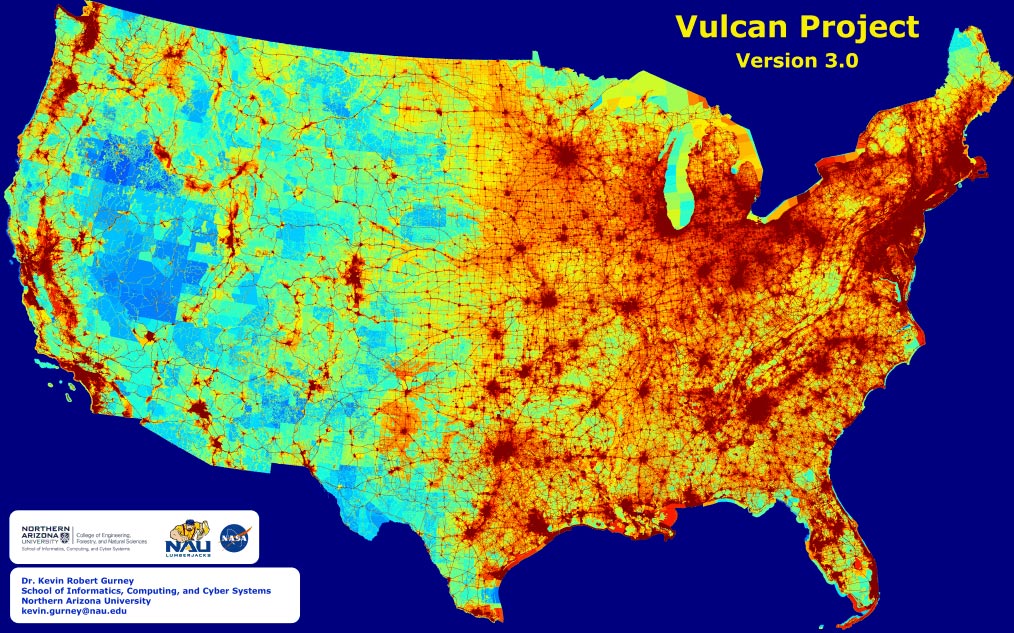
Map features greenhouse gas emissions across the entire US landscape at high space- and time-resolution with details on economic sector, fuel, and combustion process.
With intense wildfires in the western U.S. and frequent, intense hurricanes in the Gulf of Mexico, the nation is again affected by extreme weather-related events resulting from climate change. In response, cities, states and regions across the country are developing policies to reduce their emissions of greenhouse gases, chiefly carbon dioxide (CO2). Even though many state and local governments are committed to these goals, however, the emissions data they have to work with is often too general and too expensive to provide a useful baseline and target the most effective policy.
Professor Kevin Gurney of Northern Arizona University’s School of Informatics, Computing, and Cyber Systems today published results in the Journal of Geophysical Research detailing greenhouse gas emissions across the entire U.S. landscape at high space- and time-resolution with details on economic sector, fuel, and combustion process.
Gurney, who specializes in atmospheric science, ecology and public policy, has spent the past several years developing a standardized system, as part of the Vulcan Project, that quantifies and visualizes greenhouse gases emitted across the entire country down to individual power plants, neighborhoods and roadways, identifying problem areas and enabling better decisions about where to cut emissions most effectively. Leading up to the nationwide study, Gurney produced emissions maps of several different large cities, including the Los Angeles megacity, Indianapolis, the Washington, D.C./Baltimore metropolitan area and Salt Lake City.
Funded by NASA, Gurney developed the high-resolution emissions map as an effective tool for scientific and policy applications. His goal is to provide policymakers across the nation with a means to strategically address problem areas instead of taking an inefficient, costly approach.
“We’re providing U.S. policymakers at national, state and local scales with a scalpel instead of a hammer. Policies that might be relevant to California are possibly less relevant for Chicago or New York. They need to have information that reflects their unique conditions but follows a rigorous, standardized scientific approach. In this way, they can have confidence in the numbers which, in turn, will stimulate smart investment in reducing emissions.”
One of the strengths of Gurney’s approach is validation by atmospheric monitoring of CO2 from ground-based and satellite instruments.
“By synthesizing the detail of building and road-scale emissions with the independence and accuracy of atmospheric monitoring,” Gurney said, “we have the best possible estimate of emissions with the most policy-relevant detail.”
Through characterization of CO2 emissions across the entire US landscape every kilometer, from coast to coast, Gurney points out that the system offers every US city an inventory on emissions. “By extracting all cities in the US from our data product, we can offer every city a consistent and comprehensive assessment of their emissions. Like the US weather forecasting system, this problem is best solved with a single systemic approach and shared with city stakeholders so they can do what they know how to do better than anyone – reduce emissions in ways that meet their individual needs.” Gurney said.
Reference: “The Vulcan Version 3.0 High‐Resolution Fossil Fuel CO2 Emissions for the United States” by Kevin R. Gurney, Jianming Liang, Risa Patarasuk, Yang Song, Jianhua Huang and Geoffrey Roest, 15 September 2020, JGR Atmospheres.
DOI: 10.1029/2020JD032974
Data from the Vulcan mapping project is available on the Oak Ridge National Laboratory Data Archive. Additional imagery is available on the Vulcan website. This research was made possible through support from the National Aeronautics and Space Administration grant NNX14AJ20G and the NASA Carbon Monitoring System program, Understanding User Needs for Carbon Information project (subcontract 1491755).
Gurney joined NAU in 2018, where he is continuing the research he started in roles at other universities. He has been involved with the United Nations Climate Change Framework Convention and the Kyoto Protocol for 25 years and is a lead author for the Intergovernmental Panel on Climate Change (IPCC). In addition to his interests in carbon cycle science and policy, he has worked on stratospheric ozone depletion, radionuclide dose assessment, energy systems and climate-economic modeling.
Never miss a breakthrough: Join the SciTechDaily newsletter.
Follow us on Google and Google News.
13 Comments
So what I see is damning evidence that the problems come from the cities, and yet those in the cities are constantly whining about the country folks that “don’t care about the environment.”
So this is actually the real reason behind the “pandemic” there is no covid scare but a scare tactic. Sometime last year in November they had a mayoral conference which had every mayor in the United States. In this meeting they decided that the CO2 was too much so they came up with a scare tactic called covid-19. Which doesn’t exist I haven’t worn a mask once at work because I can’t wear masks due to medical issues. The numbers in Michigan are just Rising because witless Whitmer it’s falsifying documentation. I found this information about the mayoral conference from Fox 47 July 20th if you don’t believe me. Look it up, God created this Earth for two people but it had enough oxygen for all of us today God created this Earth with two people but there was enough food for all of us to this day! I don’t believe in any CO2 crap just like I don’t believe in covid-19. Trust in God, science is a farce.
This is a great tool. It demonstrates that we have the ability to both quantify and localize CO2 emissions, so it is now clearly possible to enact policies to hold emitters proportionally accountable. As a conservative, I love the idea of people being held responsible for the messes they create!
You must have a hard time working with being so fat you can’t wear a mask dotmh. My heart goes out to you.
I’d love to see this map divided by a population density map. That way we can see which areas are overpolluting and underpolluting per individual. For example, New York City looks like a big CO2 emitter here, but if normalized by population, I bet they’re one of the cleanest areas in the entire country.
How about we apply this on a global scale so that the numbers actually have some meaning. The current information has absolutely no value. It shows more emissions in higher populated areas. Wow! What a revelation! Temper this thing with a little reality so that it actually has a little standing. If you reduce the emissions in the hotspots on this map by 10% it won’t even be a blip on the global map. The USA cannot clean the air of the whole world!
We can all try, though.
This video was very informative. Except for Indianapolis being labeled as Louisville.
Hey Arron, obviously you can’t read very well or prefer to make things up. Dotmh said nothing about being fat. My guess is you are a libtard and when you don’t like what you read find it easier to make personal attacks than actually research things yourself. That is typical for them. Your folks must be proud!
No I don’t care about politics..I was just attacking trying to get a rise out of a fool such as yourself. Gotta always use the word Libtard.. to narrow minded to actually say anything new or see that the person who didn’t want to wear a mask is most likely very dumb and possibly spreading his germs to everyone who walks past his diseased body. Also like you I generalized a type of people saying because he didn’t want to wear a mask he was most likely fat but your didn’t see that..cya overweight an most likely I’ll educated person. Heh libtard..you can’t seem to read at all..
Hello!
it’s really getting worse!
last year it was not that hot but last May-June I started using the aircon in the afternoon! (It was summer that time)
If you follow Electroverse, you will find that, far from having Global Warming, we are heading for Global Cooling as part of a long term cycle. It’s going to make a lot of people & governments look very stupid.
Dotmh, you don’t believe in covid nor climate change because you don’t think. What part of climate change is fake? The part about how burning fossil fuels puts carbon in the atmosphere? Or the part about how increased carbon changes the atmosphere’s heat balance? If it is all about God then God does not command us to burn fossil fuels so shouldn’t you stop doing it? Actually God created people to be intelligent, creative, and loving: to think and fix the problems that we create.