Satellite laser ranging revealed ocean mass growth as the main driver of rising seas. Melting land ice now dominates sea-level change.
The increase in global mean sea level (GMSL) is a key signal of climate change. Researchers at The Hong Kong Polytechnic University (PolyU) have applied advanced space-based geodetic methods to produce the first accurate 30-year record (1993–2022) of global ocean mass change, also known as barystatic sea level. Their analysis shows that changes in ocean mass play the leading role in driving sea-level rise.
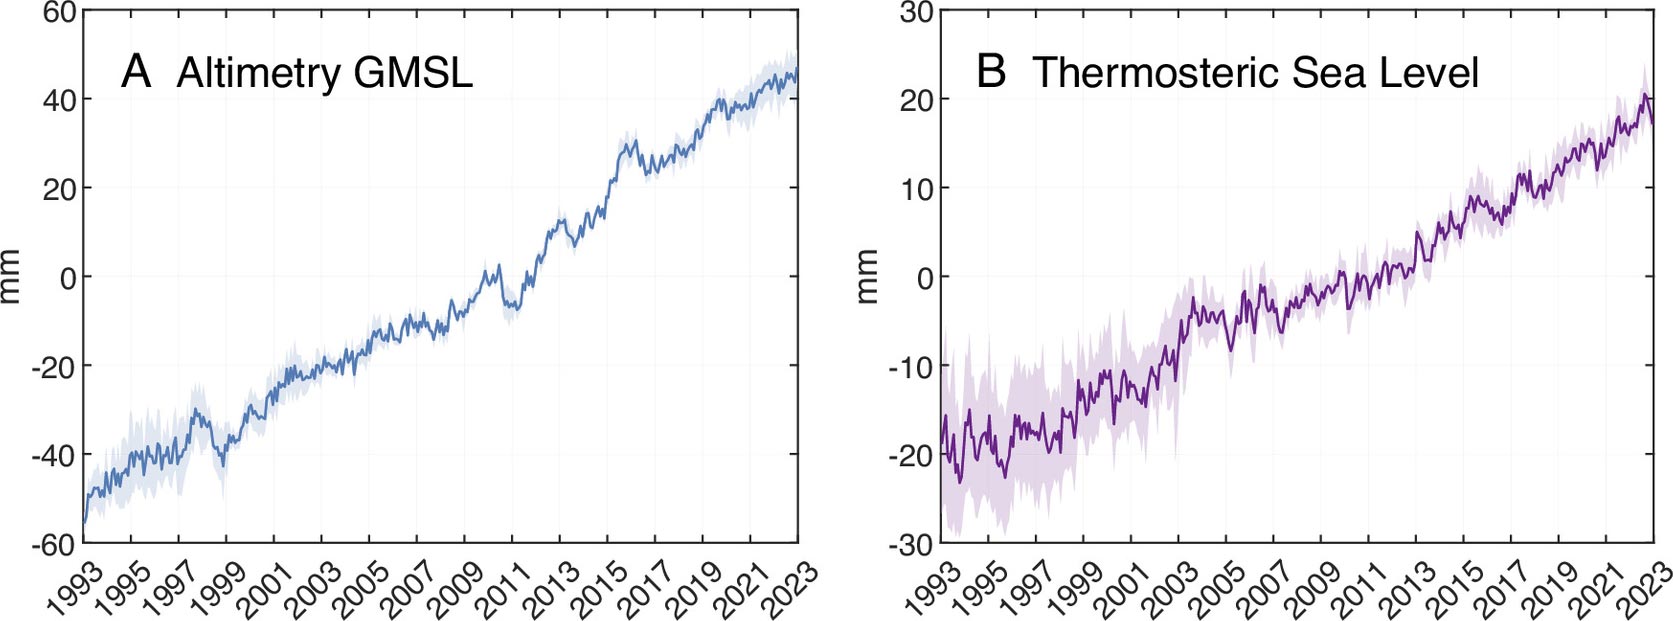
The study also found that GMSL has been rising at an average of about 3.3 millimeters per year, with a clear acceleration over time, underscoring the worsening impacts of climate change. The results were published in the Proceedings of the National Academy of Sciences.
Two main processes are responsible for GMSL rise: the thermal expansion of seawater, as the oceans absorb roughly 90% of the excess heat from Earth’s climate system, and the growth in ocean mass caused by freshwater input from melting land ice. Continuous monitoring of ocean mass change is therefore critical to understanding current sea-level trends.
Satellite laser ranging and innovation
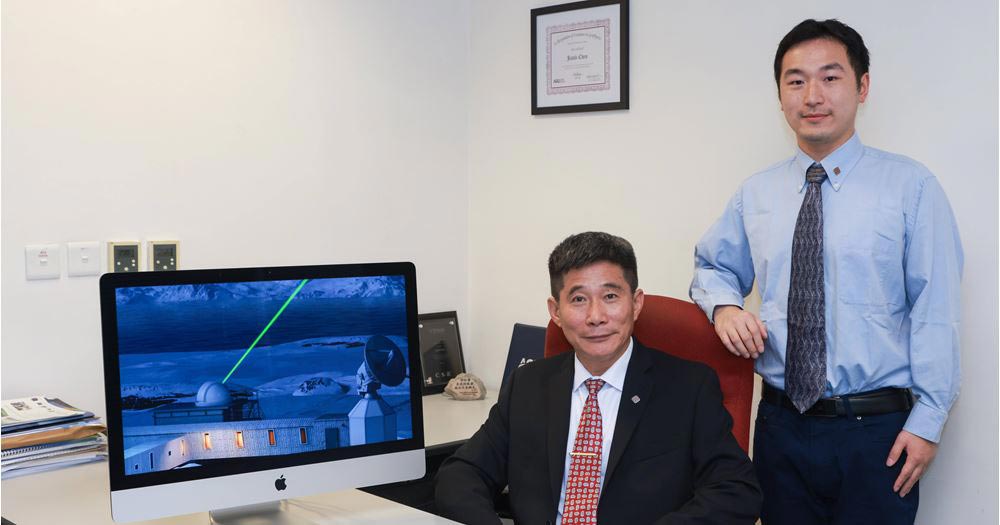
A team led by Prof. Jianli Chen, Chair Professor of Space Geodesy and Earth Sciences in PolyU’s Department of Land Surveying and Geo-Informatics (LSGI) and a core member of the PolyU Research Institute for Land and Space, together with Dr. Yufeng Nie, Research Assistant Professor of LSGI and lead author of the study, has for the first time provided direct global ocean mass estimates covering 1993 to 2022. This was achieved using time-variable gravity field data obtained through satellite laser ranging (SLR).
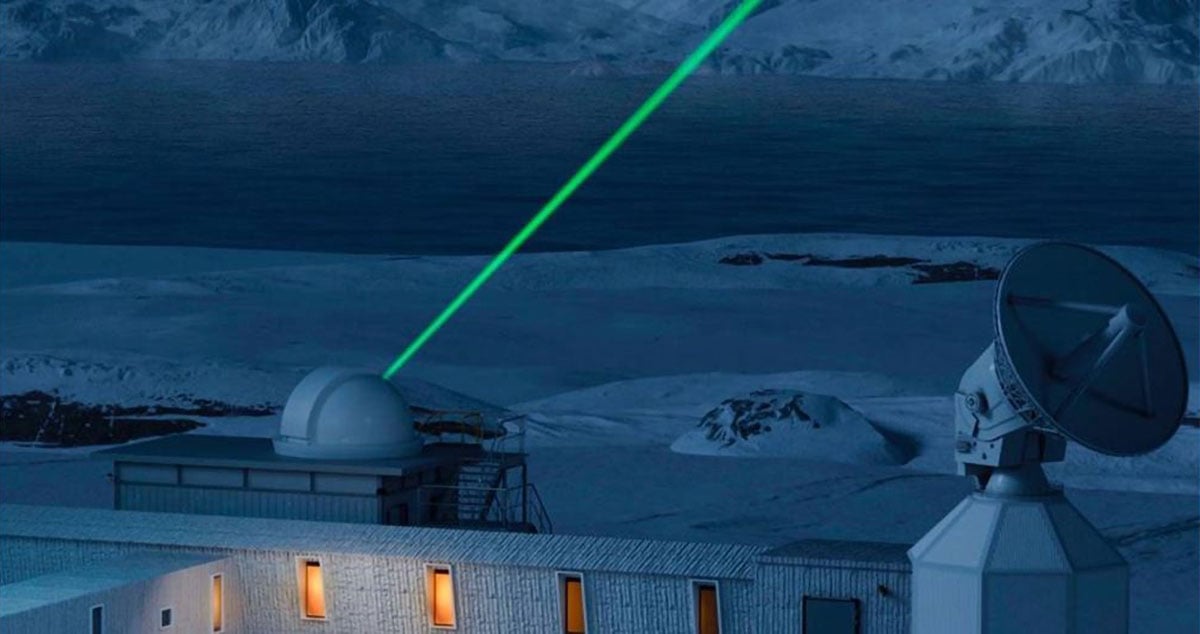
Until now, projections of sea-level rise primarily relied on satellite altimetry. Records of barystatic sea level from satellite gravimetry only became possible with the 2002 launch of the Gravity Recovery and Climate Experiment. SLR, a long-established geodetic method, measures the distance between ground stations and satellites using laser pulses.
However, limitations such as the small number of satellites and ground stations, the high orbital altitudes (which restrict SLR data to detecting only very long-wavelength gravitational changes), and the low-degree resolution of measurements have historically limited its direct use in estimating ocean mass change.
Overcoming limitations with forward modelling
To effectively utilize SLR-derived gravitational fields for accurate estimates of ocean mass change, the research team implemented an innovative forward modelling technique that tackles spatial resolution limitations by incorporating detailed geographic information of ocean-land boundaries. This approach enables long-term monitoring of global ocean mass changes.
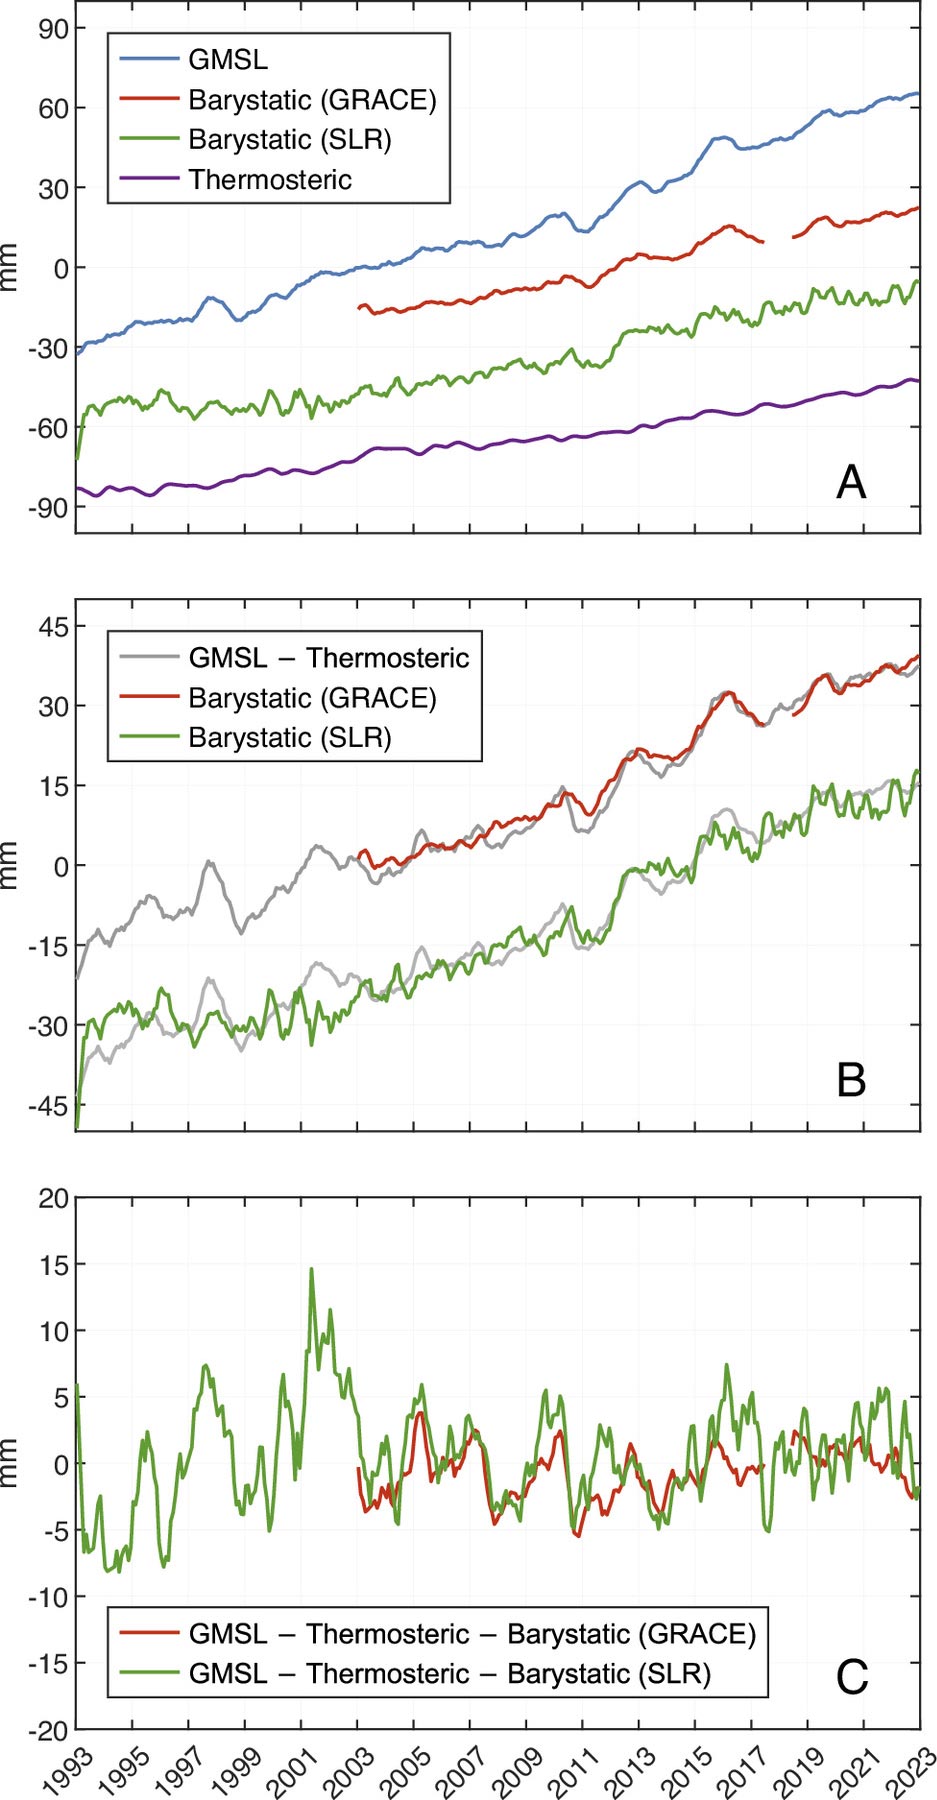
The research revealed that an increased rate of GMSL resulted in a global average sea-level rise of approximately 90 mm between 1993 and 2022, with about 60% of this rise attributable to ocean mass increase. Since around 2005, the rise in GMSL has been primarily driven by the rapid increase in global ocean mass.
This overall increase is largely driven by the accelerated melting of land ice, particularly in Greenland. Throughout the entire study period, land ice melt from polar ice sheets and mountain glaciers accounted for over 80% of the total increase in global ocean mass.
Prof. Jianli Chen said, “In recent decades, climate warming has led to accelerated land ice loss, which has played an increasingly dominant role in driving global sea-level rise. Our research enables the direct quantification of global ocean mass increase and provides a comprehensive assessment of its long-term impact on sea-level budget. This offers crucial data for validating coupled climate models used to project future sea-level rise scenarios.”
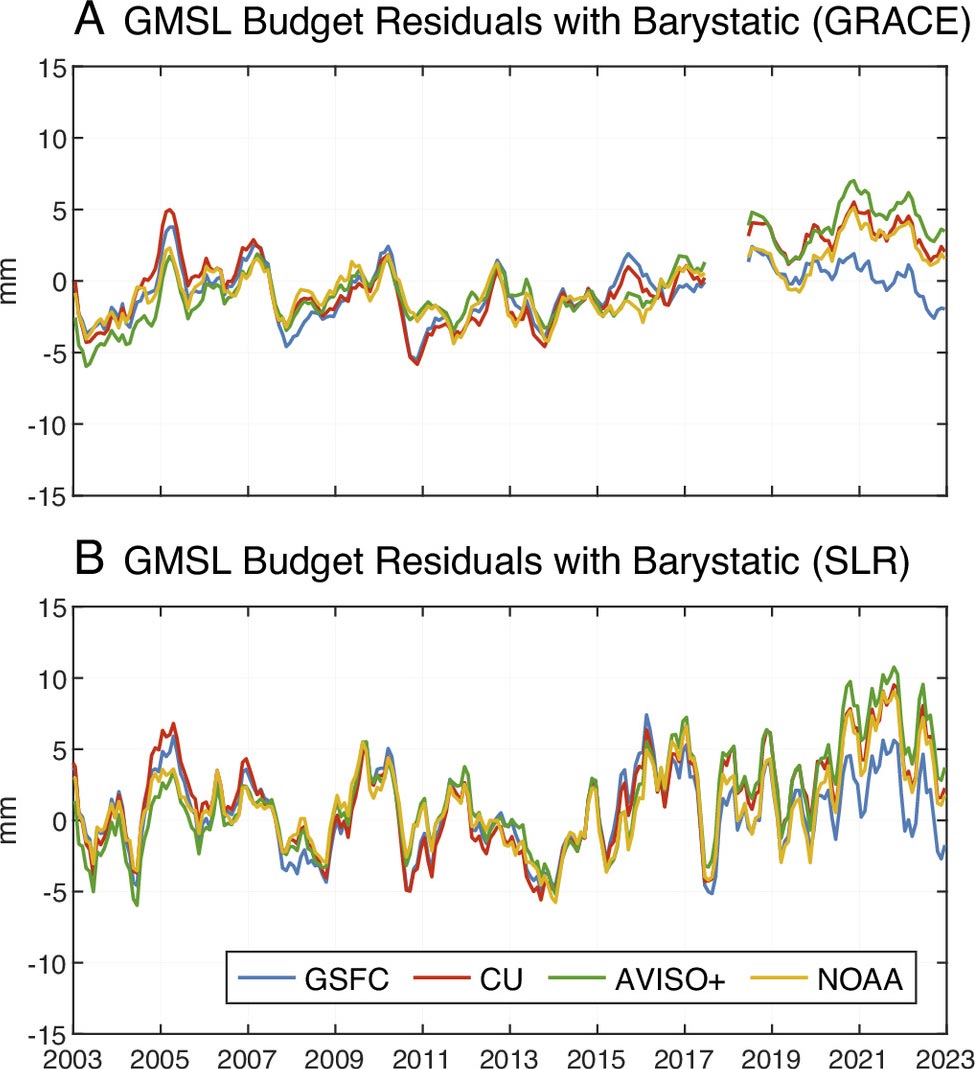
Dr. Yufeng Nie said, “The research showed that the ocean mass changes derived from SLR analysis align well with the total sea level changes observed by satellite altimeters, after accounting for the effect of ocean thermal expansion. This demonstrates that the traditional SLR technique can now serve as a novel and powerful tool for long-term climate change studies.”
Reference: “Barystatic sea level change observed by satellite gravimetry: 1993–2022” by Yufeng Nie, Jianli Chen, Guodong Xu and Anno Löcher, 30 June 2025, Proceedings of the National Academy of Sciences.
DOI: 10.1073/pnas.2425248122
This work was supported by the National Natural Science Foundation of China (42394132), Hong Kong Research Grants Council Collaborative Research Fund (C5013-23G) and PolyU Strategic Hiring Scheme and Department of Land Surveying and Geo-Informatics Internal Research Funds (Project IDs: P0042322 and P0041486).
Never miss a breakthrough: Join the SciTechDaily newsletter.
Follow us on Google and Google News.
5 Comments
“The study also found that GMSL has been rising at an average of about 3.3 millimeters per year, with a clear acceleration over time, …”
The elements of graph A all appear to be quite linear to me, at least since about 1999. Without error bars (uncertainty bounds) on the lines, it is difficult to tell what is noise.
However, I’m surprised that the question of why tide gauges don’t agree with the estimates from satellites isn’t addressed.
Liar type systems work great from satellites looking at land but fail miserably when you try and measure large bodies of water. Scientific precision cannot exceed the changes of the measured level which had to include factors such as sea state, tides, pressure from changes in atmospheric pressure an old gravitational attraction. If these factors are included the Scientific precision is probably in the 1 to 3 meter level at best. Interpolation these reading looking for a 3.0 mm rise putting the measurement in the background noise level and totally worthless.
Sea levels are measured for the whole World by the Liverpool Oceanic Institute and they show that he Oceans are rising at 2.8- 3 mm Pa .an inch every nine years,just as they have been doing since we entered the Current Grand SolarMaximum at the end of the Maunder Minimum 300 years ago,but hey,why let facts get in the way of a good headline. The only dangers to Human life and prosperity are the Cynical Alarmists,who know better,and the danger of a new Ice age which is due.
A job I did back in 1980 involved a study of an estuary back to 1840. At 1 inch per 9 years that is a sniff more than 15 inches by 1980 which might a a bit significant. There was a major change to the estuary outlet overnight in 1930; 1840 to 1930 is a total sea-level rise of 10 inches. That change made future real estate developments more vulnerable to erosion and perhaps it is a pity that the City planners of the 1940s were unaware of that 1 inch per year.
mmmm………1944 to 2024 is 80 years. How time has flown and sea–level grown……by yet another approx 9 inches at the rate of 1 inch per 9 years. 1840-2024 is just on 20 inches of sea- level rise with no anthropogenic global warming thrown in. That would certainly change yon estuarine tidal compartment, excluding the different lumps of water arriving into the estuary from the more rapid storm-water run-off from a growing tar-sealed and be-roofed city…….One would need to have floating tide gauges if they weren’t to get thoroughly soused by very incoming tide………..
.