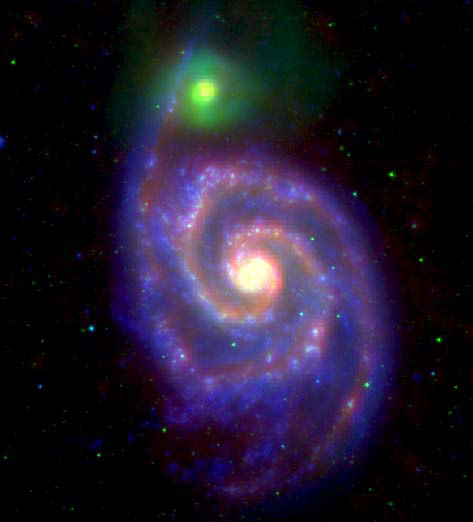
A false-color, multi-wavelength image of the interacting galaxies M51A and M51B (The Whirlpool system). Blue corresponds to ultraviolet light from hot young stars, green to light from evolved stars, and red from warm dust heated by all stars. A new study of interacting galaxies analyzes their colors across this very broad spectral range. Credit: NASA/L.Lanz
Using new observations of thirty-one interacting galaxies in fourteen systems, a new study details the first systematic analysis of the energy distribution of interacting galaxies from the early stages when disruption has only just begun to near final stages when the effects of the collision are prominent.
Collisions between galaxies are common. Indeed, most galaxies have probably been involved in one or more encounters during their lifetimes. One example is our own Milky Way, which is bound by gravity to the Andromeda galaxy, our neighbor, and towards which we are approaching at a speed of about 50 kilometers per second, perhaps to meet in another billion years or so. Galaxy-galaxy interactions are thought to stimulate vigorous star formation because the encounters somehow induce the interstellar gas to condense into stars. These stimulated starbursts in turn light up the galaxies, especially at infrared wavelengths, making some systems hundreds or even thousands of times brighter than the Milky Way while they are active. Many of the massive stars that are produced become supernovae whose explosive deaths enrich the environment with carbon, oxygen, and all the other elements that are essential for life. Interacting galaxies are important not only in shedding light on how galaxies evolve, form stars, and seed the interstellar medium, but because they can be very bright and seen across cosmological distances.
The details of galaxy collisions are only approximately understood, in part because most observed interactions involve galaxies of unequal sizes, morphologies, and stages of the interaction. Since an interaction takes billions of years to run its course, it is not possible to watch an entire sequence of events. Scientists trying to figure out the evolution of a collision can only observe many different systems at different stages, and then try to correct for all the other factors (like mass or shape) that might influence the analysis. New space-based telescopes offer some help because they can collectively observe at all wavelengths from the ultraviolet to far infrared wavelengths. These wavelengths capture most of the global activity present in galaxies from star formation: The UV detects the hottest and youngest new stars, the far infrared senses dust warmed by otherwise obscured stellar radiation, while the intermediate wavelengths sample a range of other contributing phenomena.
CfA astronomers Lauranne Lanz, Andreas Zezas, Howard Smith, Matt Ashby, Giovanni Fazio, Lars Hernquist, and Patrik Jonsson have used new observations of thirty-one interacting galaxies in fourteen systems to publish the first systematic analysis of the energy distribution of interacting galaxies across this key, broad spectral range. The galaxies are from a sample that includes all stages of interaction, from early stages when disruption has only just begun to near final stages when the effects of the collision are prominent; the published set contain every interacting galaxy in the sample for which the full dataset was available.
The team measured – and then modeled – these objects at twenty-five different wavelength bands in an effort to test how star formation and related galaxy properties are influenced in an interaction. They report that the radiative output of the dust, and its temperature, increase as the interaction progresses, and provide evidence that the star formation rate does increase as the interaction progresses. But somewhat surprisingly, they find after taking into account the different galaxy masses that the rate enhancements are not as dramatic as had been expected. This perhaps reflects the limited size of the current sample and/or the fact that because induced bursts of star formation are confined to short time intervals, they just happen to be under-represented in the current sample. The astronomers conclude by outlining future analyses that incorporate the results of simulations of interacting galaxies in order to fill in some of the missing details.
Reference: “Global Star Formation Rates and Dust Emission Over the Galaxy Interaction Sequence” by Lauranne Lanz, Andreas Zezas, Nicola Brassington, Howard A. Smith, Matthew L. N. Ashby, Elisabete da Cunha, Giovanni G. Fazio, Christopher C. Hayward, Lars Hernquist and Patrik Jonsson, 17 April 2013, The Astrophysical Journal.
DOI: 10.1088/0004-637X/768/1/90




Be the first to comment on "The First Systematic Analysis of the Energy Distribution of Interacting Galaxies"