Sixteen years of remote sensing data reveals that in Earth’s largest freshwater lakes, climate change influences carbon fixation trends.
NASA-funded research on the 11 largest freshwater lakes in the world coupled field and satellite observations to provide a new understanding of how large bodies of water fix carbon, as well as how a changing climate and lakes interact.
How Do Lakes Fix Carbon?
Phytoplankton are microscopic algae that photosynthesize, or make energy from sunlight. Carbon fixation is a part of photosynthesis — inorganic carbon (particularly carbon dioxide) is converted into an organic compound by an organism. All living things on Earth contain organic carbon. The amount of phytoplankton and the rate at which they photosynthesize equal the carbon fixation rate in a lake.
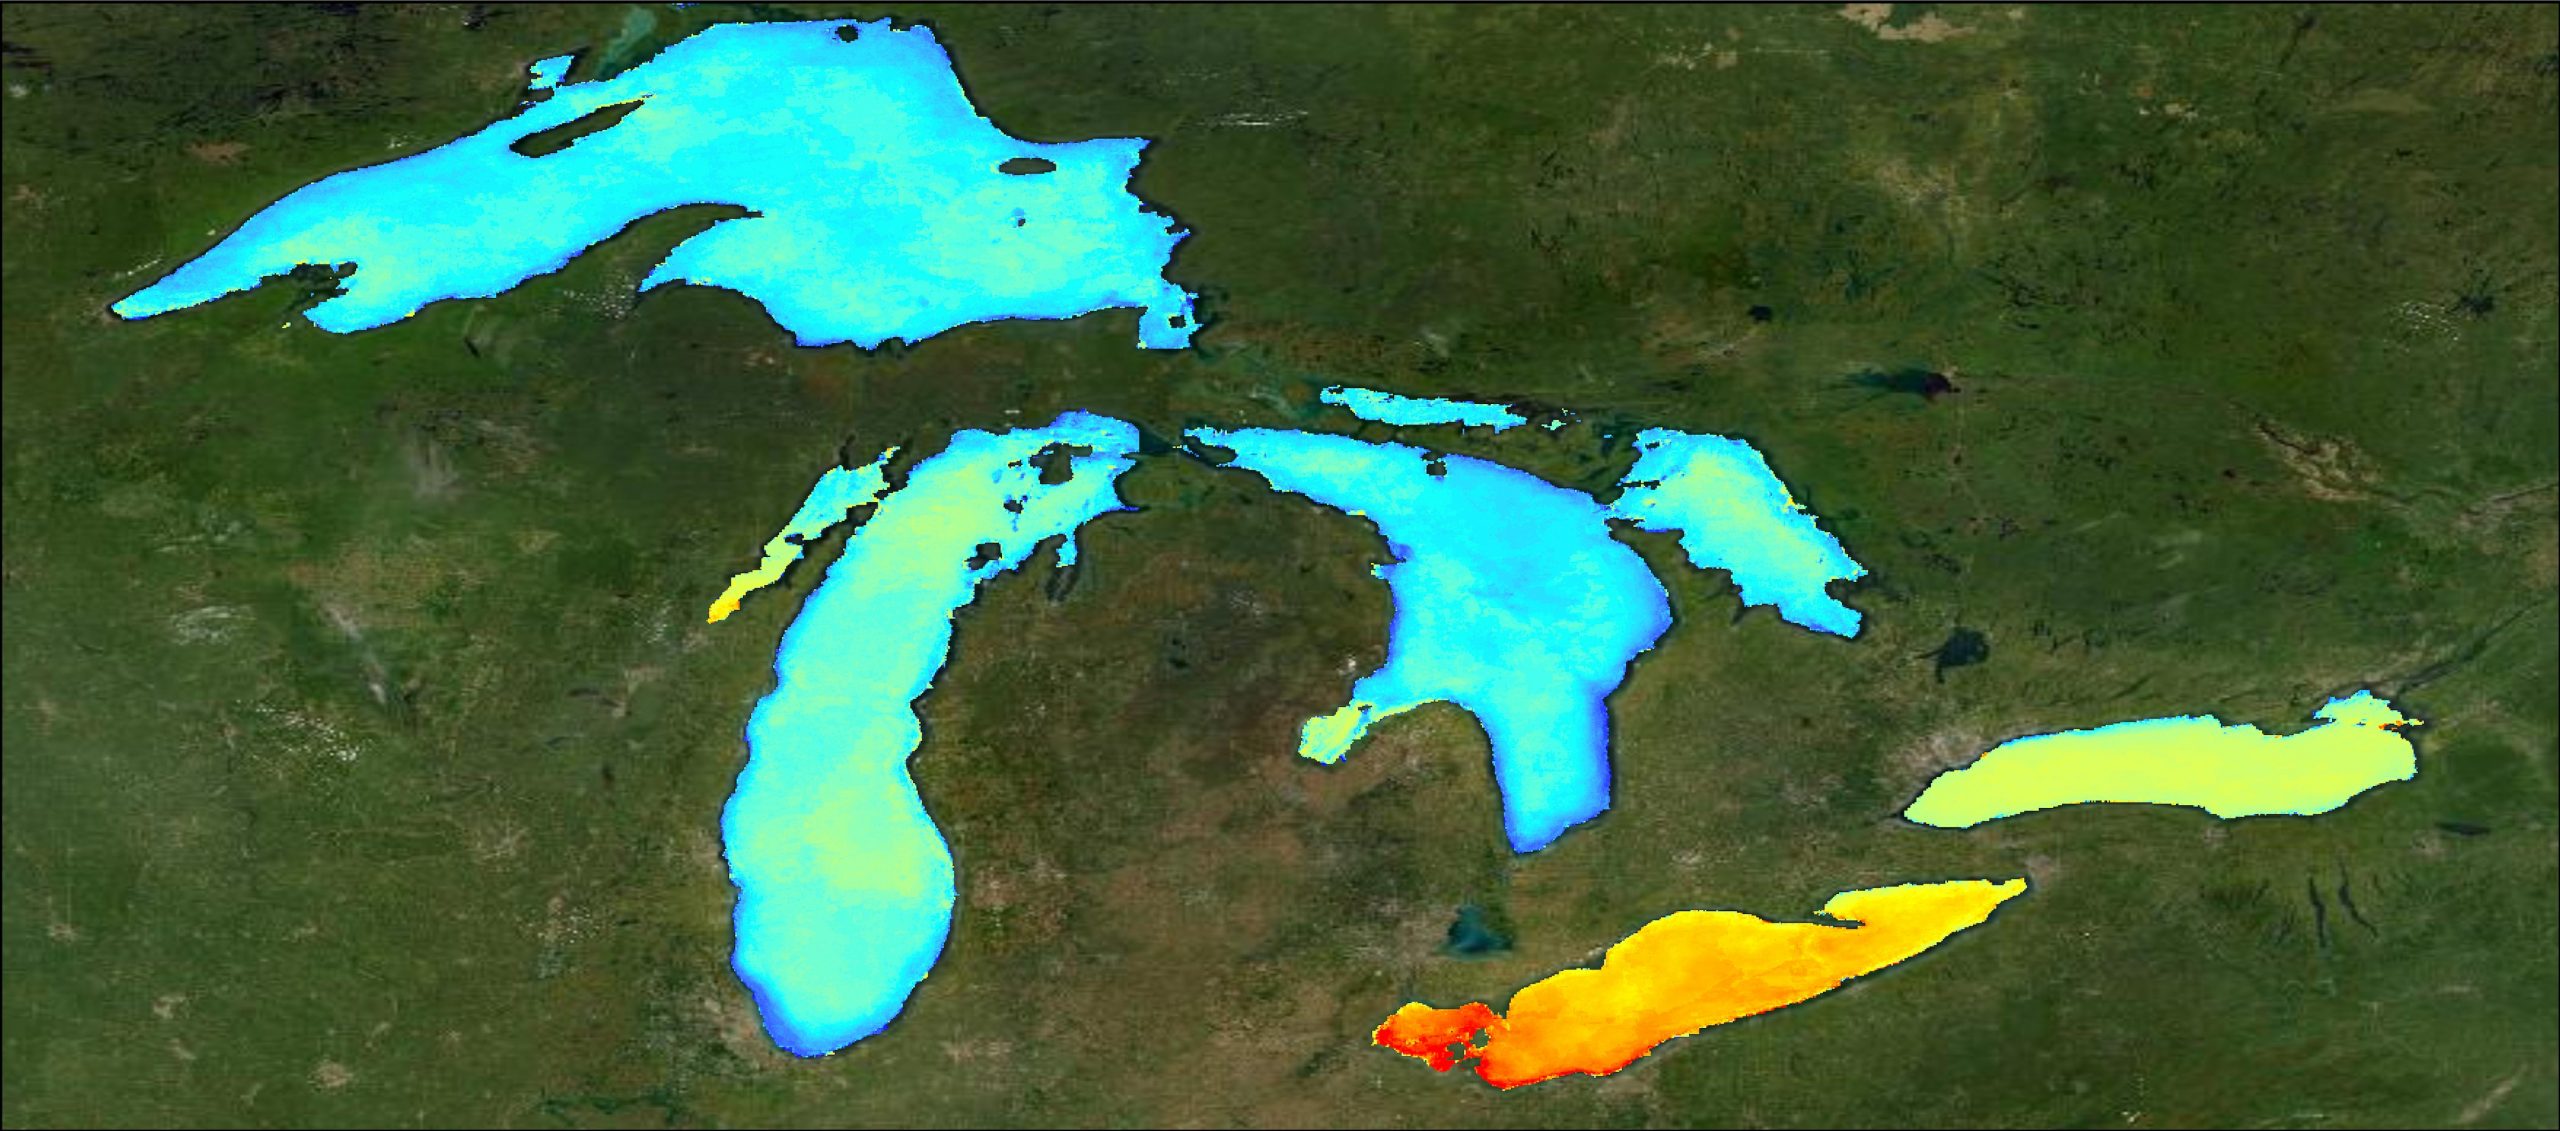
Scientists at the Michigan Tech Research Institute (MTRI) studied the five Laurentian Great Lakes bordering the U.S. and Canada; the three African Great Lakes, Tanganyika, Victoria and Malawi; Lake Baikal in Russia; and Great Bear and Great Slave lakes in Canada.
These 11 lakes hold more than 50% of the surface freshwater that millions of people and countless other creatures rely on, underscoring the importance of understanding how they are being altered by climate change and other factors.
The two Canadian lakes and Lake Tanganyika saw the greatest changes in primary productivity — the growth of algae in a water body. Productivity fluctuations point to big changes in lake ecosystems.
“The base of the food chain in these lakes is algal productivity. These lakes are oceanic in size, and are teeming with phytoplankton — small algae,” said co-author Gary Fahnenstiel, a fellow at MTRI and recently retired senior research scientist for NOAA’s Great Lakes Environmental Research Laboratory. “We measured the carbon fixation rate, which is the rate at which the algae photosynthesize in these lakes. As that rate changes, whether increasing or decreasing, it means the whole lake is changing, which has ramifications all the way up the food chain, from the zooplankton to the fish.”
Many factors affect these lakes. Climate change, increasing nutrients (eutrophication) and invasive species all combine to cause systemwide change — making it difficult to pinpoint specific causes, particularly from the ground with limited on-site observations.
Counting Phytoplankton With Color
But satellite imagery has made sorting through the noise easier and provides insights over time and space. Michael Sayers, MTRI research scientist and study lead author, uses ocean color remote sensing — making inferences about type and quantity of phytoplankton based on the color of the water — to track freshwater phytoplankton dynamics.
“We’ve relied on NASA assets — the MODIS satellite, which has been flying since 2002, to which we apply the algorithm and model we’ve been developing at MTRI for a decade,” Sayers said. “When we start to tally the numbers of pixels as observations globally for 11 lakes for 16 years, it is really quite remarkable.” The pixels observed per lake number “in the millions,” he added.
One of the most remarkable aspects of the results is just how fast changes in these freshwater lakes have occurred — a noticeable amount in fewer than 20 years. The research contributes to NASA’s Carbon Monitoring System’s goal of determining how much freshwater lakes contribute to the global carbon cycle.
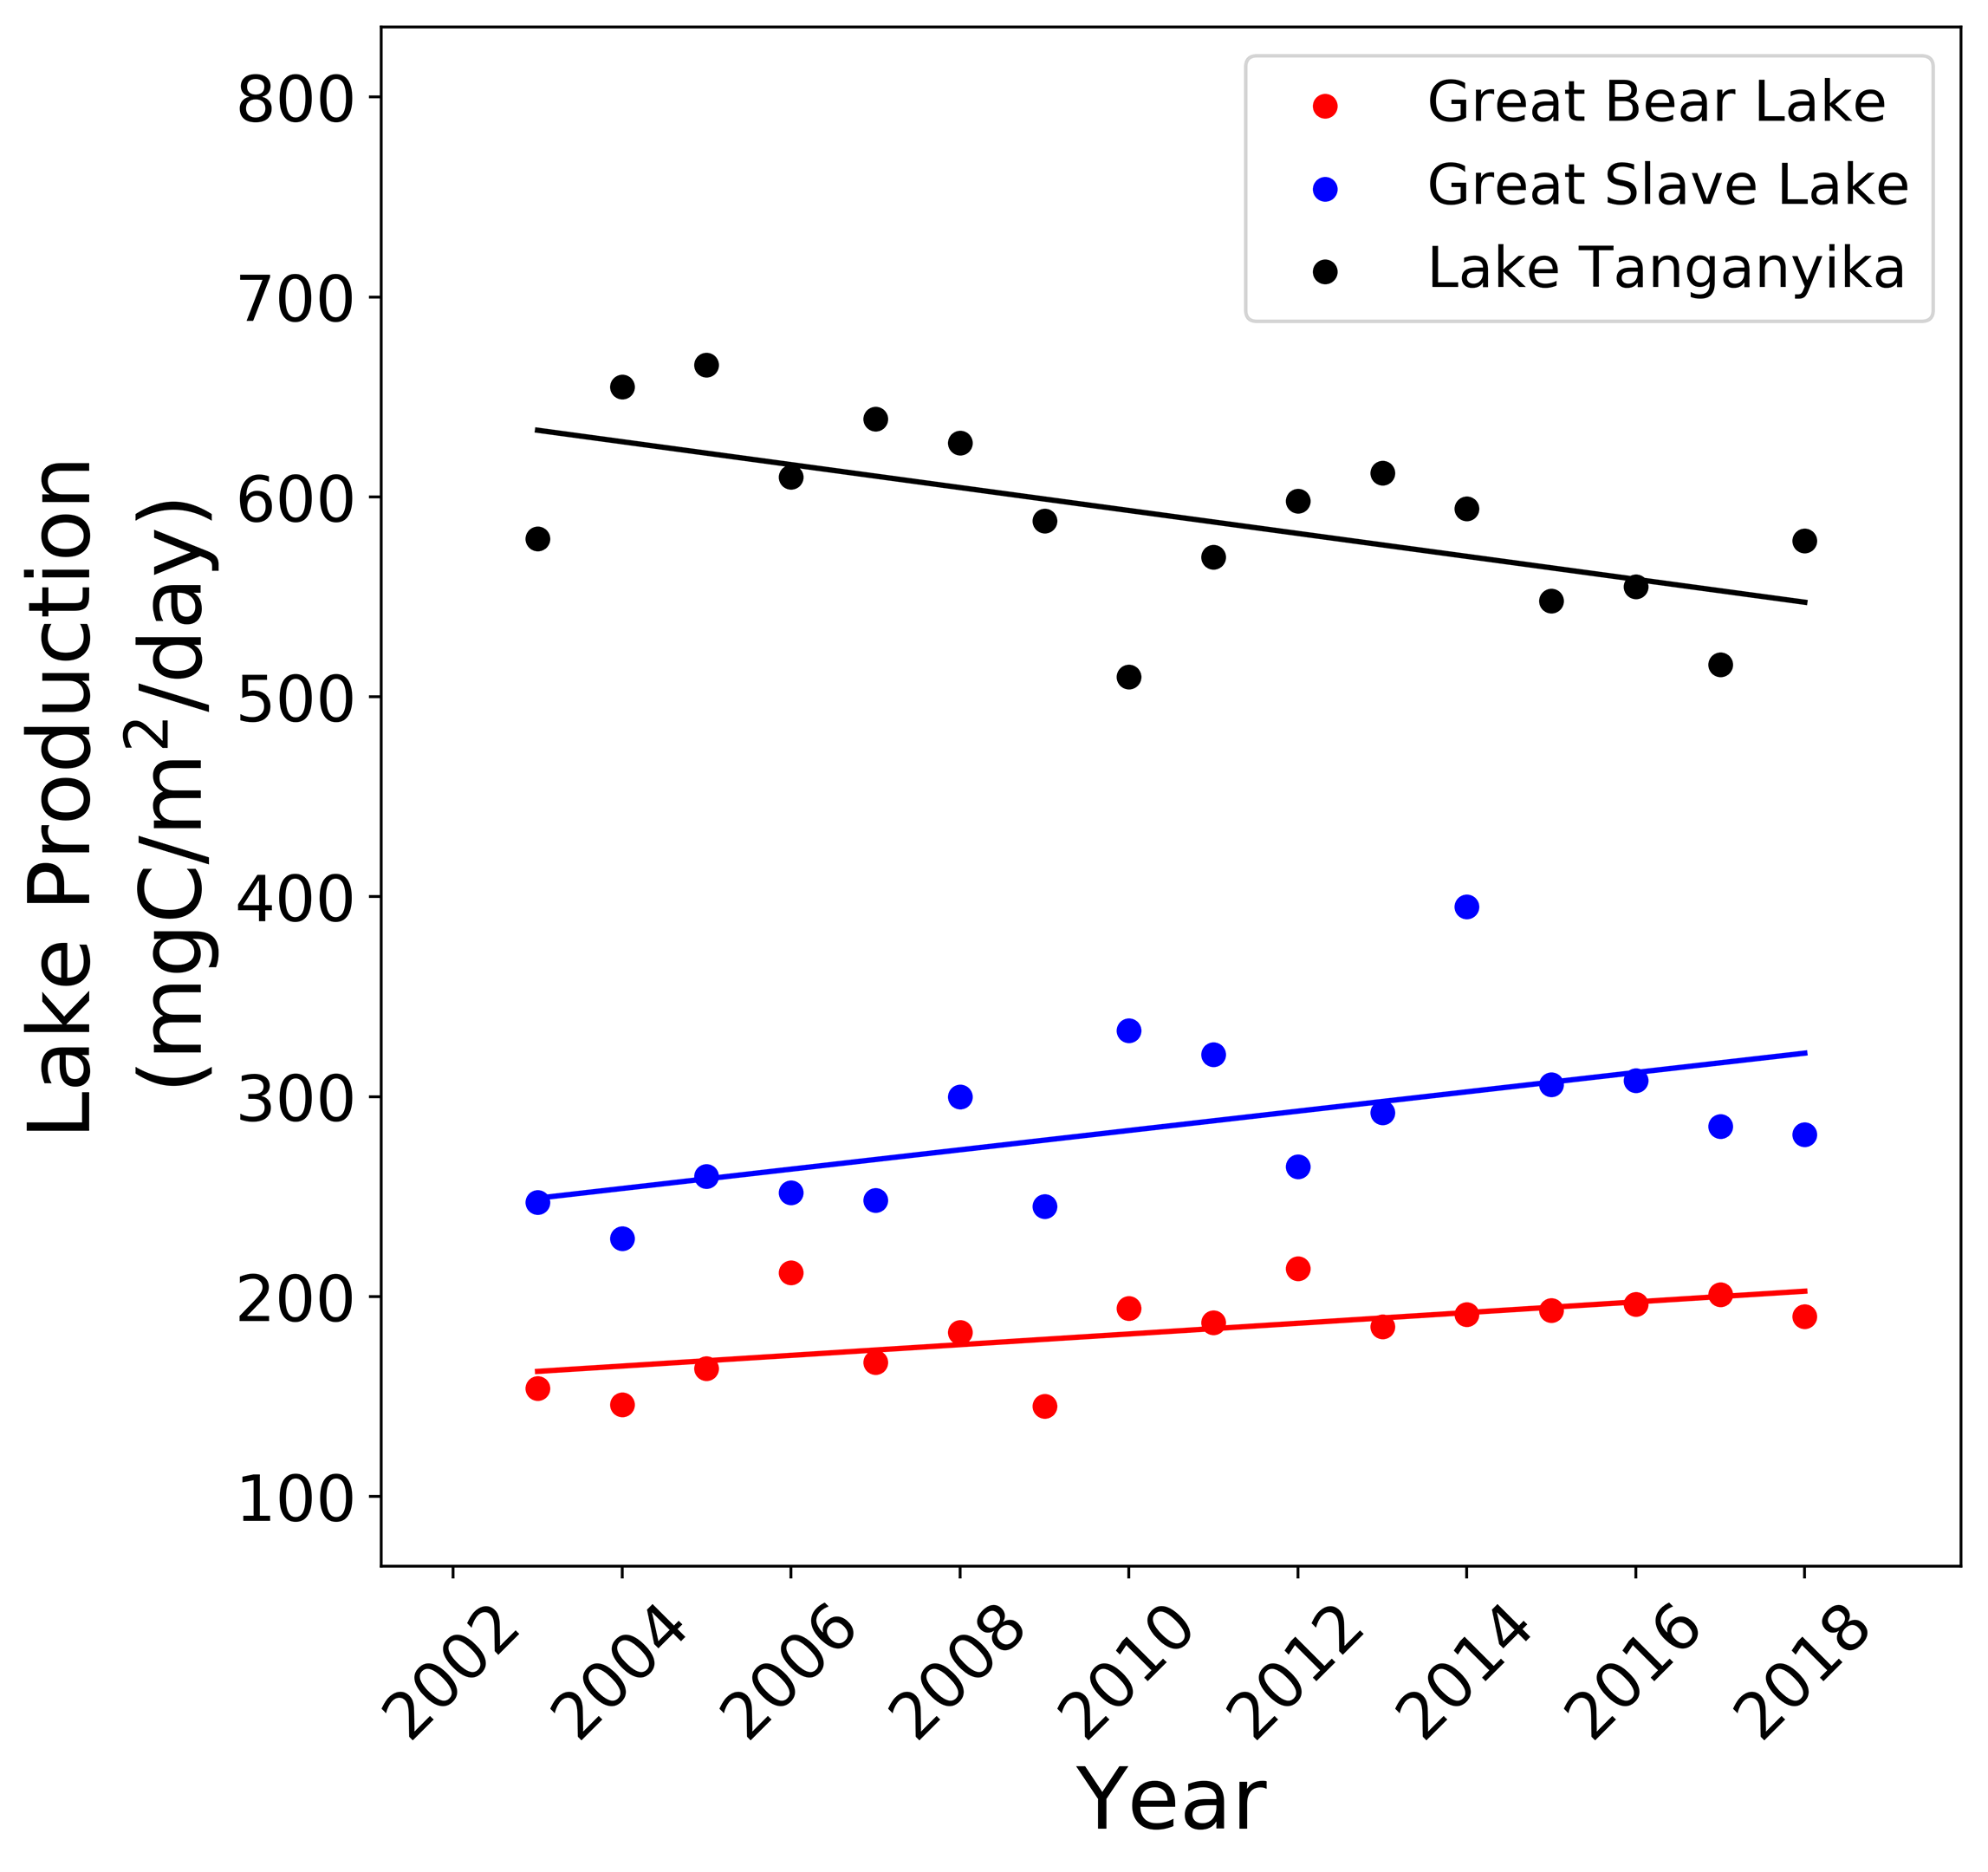
“Three of the largest lakes in the world are showing major changes related to climate change, with a 20-25% change in overall biological productivity in just the past 16 years,” Fahnenstiel said.
More Than Algae
In the 16 years of data, Great Bear and Great Slave lakes in northern Canada saw the greatest increases in productivity, while Lake Tanganyika in southeastern Africa has seen decreases. The trends are linked to increases in water temperatures, as well as solar radiation and a reduction in wind speed.
Sayers said looking at productivity, algal abundance, water clarity, water temperature, solar radiation and wind speeds at freshwater lakes provides a richer picture of the overall ecosystem.
“Temperature and solar radiation are factors of climate change,” Sayers said. “Chlorophyll and water transparency changes are not necessarily caused by climate change, but could be caused by eutrophication or invasive species, like quagga mussels.”
The researchers used lake measurements performed by the Great Lakes Research Center research vessel fleet to ground truth the satellite observations and to provide input for model estimates.
The article “Carbon Fixation Trends in Eleven of the World’s Largest Lakes: 2003–2018” is published in the journal Water. The researchers plan to continue their research, applying what they’ve learned so far to the role harmful algal blooms have on carbon flux to the atmosphere.
As the saying goes, water is life. Gaining a better understanding of how lake productivity changes affect the bodies of water so many people rely on is important to the communities who live on the lakeshores. It’s also significant to the global community as we delve deeper into the role freshwater lakes play in the global carbon cycle and climate change.
Reference: “Carbon Fixation Trends in Eleven of the World’s Largest Lakes: 2003–2018” by Michael Sayers, Karl Bosse, Gary Fahnenstiel and Robert Shuchman, 12 December 2020, Water.
DOI: 10.3390/w12123500
Never miss a breakthrough: Join the SciTechDaily newsletter.
Follow us on Google and Google News.