Layers of Earth’s atmosphere are shown in a view looking across Earth’s surface from the International Space Station. Credit: NASA
New research by Lawrence Livermore National Laboratory scientists reveals that human activities are undeniably altering the thermal structure of Earth’s atmosphere. By expanding climate “fingerprinting” to the mid-to upper stratosphere, the team has improved the detection of human effects on the climate by a factor of five. The distinct patterns of CO2-driven temperature changes in these areas underscore the impossibility of natural causes explaining these shifts.
New research shows that it is now virtually impossible for natural causes to explain satellite-measured changes in the thermal structure of Earth’s atmosphere.
The analysis conducted by Lawrence Livermore National Laboratory (LLNL) scientists and colleagues for the first time demonstrates that extending “fingerprinting” techniques — used to identify the human effects on climate — to the mid-to upper stratosphere (25-50 kilometers above Earth’s surface) improves the detection of human effects on climate by a factor of five.
“Including the mid- to upper stratosphere in vertical fingerprinting yields clear evidence of human effects on the thermal structure of Earth’s atmosphere,” said Stephen Po-Chedley, LLNL climate scientist and co-author of a paper appearing in the Proceedings of the National Academy of Sciences.
Differences between tropospheric (lower layer of the atmosphere) and lower stratospheric temperature trends have long been recognized as a “fingerprint” of human effects on climate. This fingerprint, however, neglected information from the mid- to upper stratosphere, according to co-author Karl Taylor, also at LLNL.
“Extending fingerprinting to the upper stratosphere and comparing improved climate model results with observed temperature measurements, now covering 37 years, means that it is now virtually impossible for natural causes to explain satellite-measured trends in the full structure of Earth’s atmosphere,” Taylor said.
Noise in the troposphere can include day-to-day weather, interannual variability arising from El Niños and La Niñas and longer-term natural fluctuations in climate. In the upper stratosphere, the noise of variability is smaller, and the human-caused climate change signal is larger, so the signal can be much more easily distinguished.
Detectability occurs because of the distinctive pattern and magnitude of stratospheric temperature change due to CO2 emissions. The human-induced stratospheric cooling is large and grows with altitude. In contrast, natural variations in stratospheric temperature are smaller and yield a different pattern of cooling.
In simulations performed with a simple radiative convective climate model in 1967, Syukuro Manabe and Richard Wetherald quantified the temperature effects of CO2. Their research yielded warming of the troposphere and cooling of the stratosphere, with cooling predicted to amplify with greater height above the tropopause. The vertical profile of temperature predicted by Manabe and Wetherald was subsequently confirmed by more complex models and observations.
But early pattern-based studies seeking to discern a human fingerprint in weather balloon and satellite atmospheric temperature data neglected the mid- to upper stratosphere, where the temperature signal of CO2 increase is expected to be considerably larger than in the troposphere or the lower stratosphere.
“In searching for a human CO2 signal, the mid- to upper stratosphere layer has the additional advantage that it is less affected than lower atmospheric layers by particulate pollution and by human-caused changes in stratospheric ozone,” Po-Chedley said.
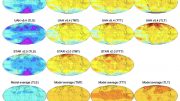
The new work expands on earlier fingerprint studies that relied solely on Microwave Sounding Unit (MSU) data for estimating latitude-height profiles of atmospheric temperature change. In the new study, the team compared the atmospheric temperature trends seen in improved satellite data sets to those obtained in newer model simulations of the historical period. The simulations provided estimates of the expected “signal” due to human influence on the climate.
The team also used an ensemble of pre-industrial control runs with no year-to-year changes in human or natural external factors. The control runs provide multi-model estimates of the “noise” resulting from natural internal variations in climate. The satellite-observed changes in atmospheric temperature were consistent with the human-caused changes and produced a large signal-to-noise ratio.
Reference: “Exceptional stratospheric contribution to human fingerprints on atmospheric temperature” by Benjamin D. Santer, Stephen Po-Chedley, Lilong Zhao, Cheng-Zhi Zou, Qiang Fu, Susan Solomon, David W. J. Thompson, Carl Mears and Karl E. Taylor, 8 May 2023, Proceedings of the National Academy of Sciences.
DOI: 10.1073/pnas.2300758120
Co-authors on the paper also included researchers from the University of California, Los Angeles (UCLA), Nanjing University, the National Oceanic and Atmospheric Administration (NOAA), University of Washington, Massachusetts Institute of Technology (MIT), Colorado State University, University of East Anglia, and Remote Sensing Systems.
The LLNL portion of the work is funded by the Department of Energy, Office of Science, Regional and Global Model Analysis Program. The paper was led by former LLNL scientist Ben Santer, who is now at the Woods Hole Oceanographic Institution and UCLA.


With the amount of CO2 put into the atmosphere, I believe there’s no way it doesn’t have effects. The question is to what degree, what difference our choices can make (if any), or at least what changes can’t be counterproductive. Nobody cares if the stratosphere increases a few degrees from -60c, but it could offer clues to climate change. 37 years of data is barely enough time to consider anything a climate, let alone detect a change in that climate; anyone reading this probably is older data than they used. I’m glad they did some math to advance our nascent understanding of the stratosphere, but this is an attention-seeking dopey way to announce it.
https://www.drroyspencer.com/2023/06/climate-fearmongering-reaches-stratospheric-heights/