A recent study, built to enable local action, highlights the severe climate impacts resulting from a 2°C temperature rise.
This summer, the headlines have been dominated with reports of extreme weather: from raging wildfires in Canada to perilous floods in India, Japan, and the Eastern US; intense heat waves have scorched Spain, China, the US, and Mexico, culminating in the hottest day ever recorded on our planet.
A recent study conducted by scientists at the Bay Area Environmental Research Institute (BAERI) and NASA Ames Research Center provides a thorough examination of how these extreme events will worsen as our planet’s temperature creeps upwards, and where these events are more likely to clash and combine in ways that significantly impact people’s lives and livelihoods.
The study uses a publicly available NASA dataset, the NASA Earth eXchange – Global Daily Downscaled Projections (NEX-GDDP), that can “zoom in” on projected changes to a local scale, allowing any community in the world to start preparing today.
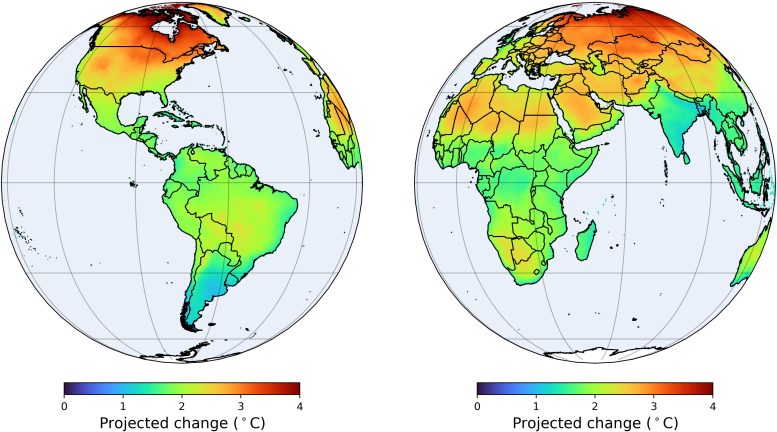
The study looked at a world where warming exceeds two degrees Celsius compared to pre-industrial times. It focused on the geographic patterns of projected changes to key climate variables, including changes to air temperature, precipitation, relative humidity, solar radiation, and wind speed. Two degrees of warming is widely considered to be a critical threshold above which Earth will witness the dangerous and cascading effects of human-generated climate change. According to the study, two degrees of warming is expected to occur sometime in the 2040s, though variation exists across projections from different climate models.
Climate variables don’t act in isolation. “We wanted to study how these individual climate variables are projected to change and what their combined impacts could mean for people around the world. The changes in one variable can compound the effects of another. We need to look at them together to understand the real impact on human lives,” said Taejin Park, a researcher at BAERI and the first author on the paper.
The researchers paid special attention to two climate impact indicators: the first is heat stress or the combined effects of temperature and humidity on the human body. They found most regions of the world will experience higher heat stress in the 2040s compared to the 1950–1979 baseline, while equatorial countries will suffer more from a greater number of days considered extreme (e.g., a month of additional extreme heat stress days for countries in Eastern Africa).
The study also examined fire weather, another climate impact indicator. It showed a global increase in extreme fire weather, which is measured by combining the variables of temperature, rainfall, humidity, wind, and more into a fire weather index, or FWI. The researchers noted exceptional fire weather increases in the Amazon (+4.3 FWI), central and western North America (+3.3 FWI), and the Mediterranean (+3.7 FWI).
“The escalating impacts of all the climate extremes studied could cause significant damage to communities and economies from fires, floods, landslides, and crop failures that may result,” said Ramakrishna Nemani, senior scientist at BAERI and co-author of the study. Floods and droughts in particular are likely to become “more frequent, more intense, longer, or all three.”
Creating Unique Climate Insights Using Big Data
The NEX-GDDP dataset used for this research provides global, daily climate projections out to the year 2100. To create this dataset, the team took projections generated by the world’s leading climate models and used advanced statistical techniques to “downscale” them, a process that significantly improves spatial resolution.
Raw climate model projections give global, daily results for areas of about 120 by 120 miles (200 by 200 kilometers). The NEX-GDDP dataset zooms in to about 15 by 15 miles (25 by 25 kilometers), a resolution that could help leaders develop targeted climate adaptation and mitigation plans.
Downscaling processes often merge daily projections into monthly averages, but keeping the day-to-day data is important for capturing extreme events. If merged into a monthly average, Park explained, a few days projected to be dangerously hot and humid could get lost in the numbers, concealing the risk for human lives.
The conclusions of the study indicate the urgent need for decision-makers to understand the compounding climate impacts projected for their regions. The uniquely regional scale of the NEX-GDDP data can help local leaders develop climate adaptation and mitigation plans specific to their communities. “Data holds value only when it guides action, and the true value of NEX-GDDP is in its potential to drive positive change at a meaningful scale globally,” said Bridget Thrasher who led the development of NEX-GDDP data and is co-author of the study. The team is keen to make their data accessible to global communities and local decision-makers to enable positive real-world changes.
Reference: “What Does Global Land Climate Look Like at 2°C Warming?” by Taejin Park, Hirofumi Hashimoto, Weile Wang, Bridget Thrasher, Andrew R. Michaelis, Tsengdar Lee, Ian G. Brosnan and Ramakrishna R. Nemani, 20 December 2022, Earth’s Future.
DOI: 10.1029/2022EF003330
As of today, you can download the study’s fire weather data here—heat stress and other indicators will be available soon—and the authors are currently working to incorporate all of the study’s data into NASA’s interactive Earth Information Center.
Never miss a breakthrough: Join the SciTechDaily newsletter.
Follow us on Google and Google News.
3 Comments
The first image and paragraph sets the tone for this.
Canada has wildfires every year, and had the fewest of any year just a couple years ago. Forestry management has failed there, being more concerned with diverse and inclusive employees setting fire to Banff, but the wildfires are natural and desirable. The wind was blowing South this time, so you noticed it. It was summer in Europe, with the same temperatures as a decade ago, only now summer is considered climate change.
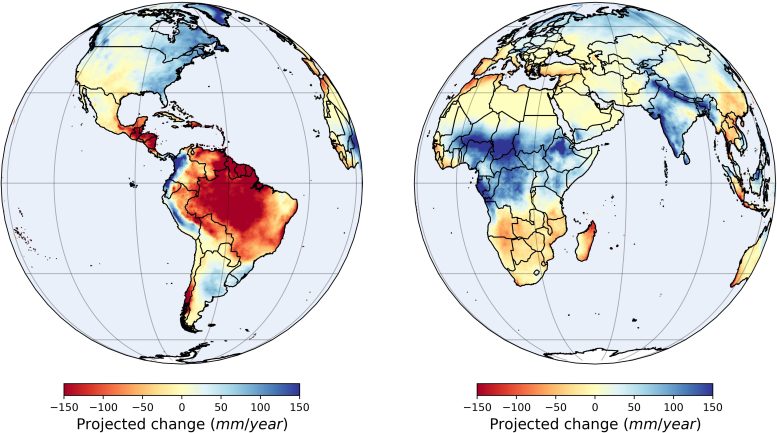
This study took the conclusions of climate models which have overestimated changes, and simulates those conclusions to the world weather. For some reason they think it will stop raining in the Americas’ tropics but rain more in the African tropics, so good luck with that prediction. But the main change they figure is the Canadian and Russian arctic would warm 4c, so Yakutsk may go from a winter of -65c (-85f) to -61c (-78f), terrifying heatwave.
In the photo, what planet is that? I see a vaguely India shaped thing with a giant Lanka, but compare it to the map just below; everything else is wrong for it to be Earth. Not to mention the combustion physics…so I should really ask what universe that’s supposed to be in, making the article make more sense as sci-fi.
Why, when CO2 is considered a “well-mixed” gas, are the high-northern latitudes warming so much more than the same southern latitudes?
Why is the Amazon expected to lose as much precipitation as sub-Saharan Africa is expected to gain when they are at comparable latitudes? Then there is the problem that actual field work has found that the trends in Africa are the opposite to what the models are predicting?
https://scitechdaily.com/tipping-the-scales-did-an-11700-year-old-event-seal-the-horn-of-africas-dry-fate/
How is this explained? We are expected to support significant changes in our life styles and economies because models make predictions that are not supported by actual measurements. What is rational about that?
“The changes in one variable can compound the effects of another. We need to look at them together to understand the real impact on human lives,”
The mid-range value [(Tmax-Tmin)/2], commonly called an average, is a poor way to discover how the variables interact. For one thing, one can get the same mid-range value from very different extremes. What is needed is an actual distribution of many measurements over a 24-hour period; if one feels compelled to simplify, then presenting an arithmetic mean, instead of a mid-range, is a step in the right direction.
NASA, NOAA, and IPCC seem to be better at providing colorful maps than maps that are accurate. More is needed for good science than pious proclamations and pretty maps!