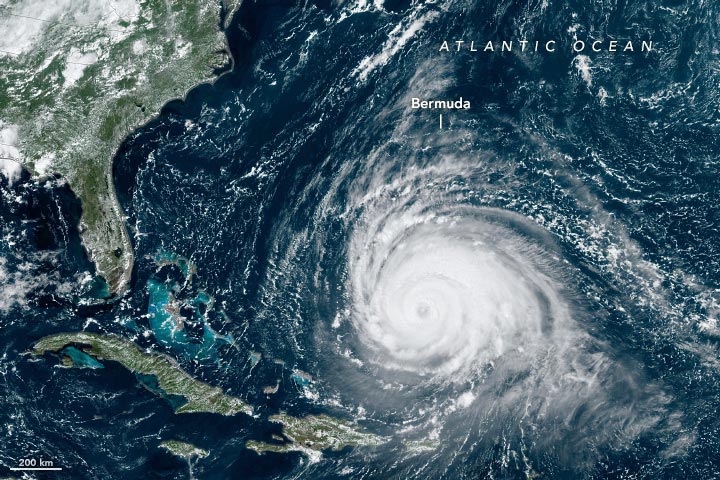
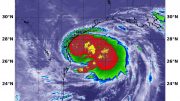
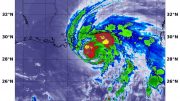
Satellite image of Hurricane Lee captured on September 12, 2023, by Geostationary Operational Environmental Satellite 16.
The major storm fluctuated in intensity as it approached the U.S. East Coast.
On September 12, 2023, Hurricane Lee continued its slow west-northwest trajectory across the Atlantic Ocean. The Geostationary Operational Environmental Satellite 16 (GOES-16) acquired this image of the major storm at approximately 1 p.m. Eastern Time (17:00 UTC) as it advanced toward the southeastern United States. The satellite is operated by the National Oceanic and Atmospheric Administration (NOAA); NASA helps develop and launch the GOES series of satellites.
Around this time, the center of the hurricane was located about 500 miles (800 kilometers) south of Bermuda and moving at 6 miles (9 kilometers) per hour. Sustained winds were measured at 115 miles (185 kilometers) per hour, making it a category 3 storm on the Saffir-Simpson hurricane wind scale.
Historical Intensity Fluctuations
On its path across the ocean to this point, the hurricane fluctuated dramatically in strength, as it underwent one of the most extreme periods of rapid intensification for a North Atlantic storm in the past 40 years. In the 24 hours ending at 2 a.m. Eastern Time (06:00 UTC) on September 8, Lee’s winds increased from 80 to 165 miles per hour (130 to 265 kilometers per hour), escalating it to category 5 status. Only Hurricane Felix in 2007 and Hurricane Wilma in 2005 intensified more over a 24-hour period. Following this ramp-up, moderate to strong wind shear disrupted the storm’s circulation and weakened it to a category 2.
Gaining Momentum Again
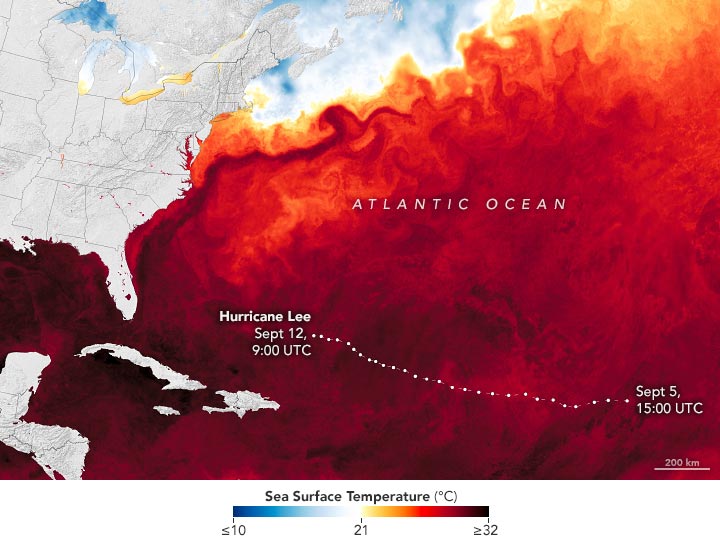
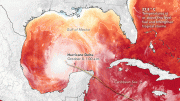
That would not be the last momentum swing, however. On September 10, Hurricane Lee began to regain strength as wind shear abated and it passed over very warm waters. The map above shows sea surface temperatures on from that day based on data from the Multiscale Ultrahigh Resolution Sea Surface Temperature (MUR SST) project, a NASA Jet Propulsion Laboratory effort that blends measurements of sea surface temperatures from multiple NASA, NOAA, and international satellites, as well as ship and buoy observations.
Sea Surface Temperatures and Hurricane Intensity
High sea surface temperatures are among the conditions favorable to hurricane intensification. And 2023 has been a banner year for warm oceans. Decades of gradual warming due to climate change, along with El Niño conditions in the Pacific Ocean, helped drive global sea surface temperatures into record territory for several months in the summer.
Meteorologists generally agree that sea surface temperatures above 27.8 degrees Celsius (82 degrees Fahrenheit) will sustain and intensify hurricanes, cyclones, and typhoons. Surface waters above that threshold are shown in red to black on the map.
Forecast for Hurricane Lee
Forecast models indicate that a weather pattern over the eastern U.S. will redirect Lee to the north. The storm is expected to expand in size and weaken as it moves over cooler waters recently churned up by hurricanes Franklin and Idalia. The storm will likely pass west of Bermuda, which is under a tropical storm watch, and potentially make landfall over the northeastern U.S. or Nova Scotia as a much weaker storm.
NASA Earth Observatory images by Lauren Dauphin, using GOES 16 imagery courtesy of NOAA and the National Environmental Satellite, Data, and Information Service (NESDIS) and data from the Multiscale Ultrahigh Resolution (MUR) project.




Be the first to comment on "Extreme Intensity Fluctuations: Hurricane Lee Traverses the Warm Atlantic"