New data from NASA’s Interface Region Imaging Spectrometer is making it possible to study the explosive phenomena in the region located between the surface of the sun and its atmosphere.
The region located between the surface of the sun and its atmosphere has been revealed as a more violent place than previously understood, according to images and data from NASA’s newest solar observatory, the Interface Region Imaging Spectrograph, or IRIS.
Solar observatories look at the sun in layers. By capturing light emitted by atoms of different temperatures, they can focus in on different heights above the sun’s surface extending well out into the solar atmosphere, the corona. On June 27, 2013, IRIS, was launched, to study what’s known as the interface region – a layer between the sun’s surface and corona that previously was not well observed.
Over its first six months, IRIS has thrilled scientists with detailed images of the interface region, finding even more turbulence and complexity than expected. IRIS scientists presented the mission’s early observations at a press conference at the Fall American Geophysical Union meeting on December 9, 2013.
“The quality of images and spectra we are receiving from IRIS is amazing,” said Alan Title, IRIS principal investigator at Lockheed Martin in Palo Alto, California. “And we’re getting this kind of quality from a smaller, less expensive mission, which took only 44 months to build.”
For the first time, IRIS is making it possible to study the explosive phenomena in the interface region in sufficient detail to determine their role in heating the outer solar atmosphere. The mission’s observations also open a new window into the dynamics of the low solar atmosphere that play a pivotal role in accelerating the solar wind and driving solar eruptive events.
Tracking the complex processes in the interface region requires instrument and modeling capabilities that are only now within our technological reach. IRIS captures both images and what’s known as spectra, which display how much of any given wavelength of light is present. This, in turn, corresponds to how much material in the solar atmosphere is present at specific velocities, temperatures, and densities. IRIS’s success is due not only to its high spatial and temporal resolution, but also because of parallel development of advanced computer models. The combined images and spectra have provided new imagery of a region that was always known to be dynamic, but shows it to be even more violent and turbulent than imagined.
“We are seeing rich and unprecedented images of violent events in which gases are accelerated to very high velocities while being rapidly heated to hundreds of thousands of degrees,” said Bart De Pontieu, the IRIS science lead at Lockheed Martin. “These types of observations present significant challenges to current theoretical models.”
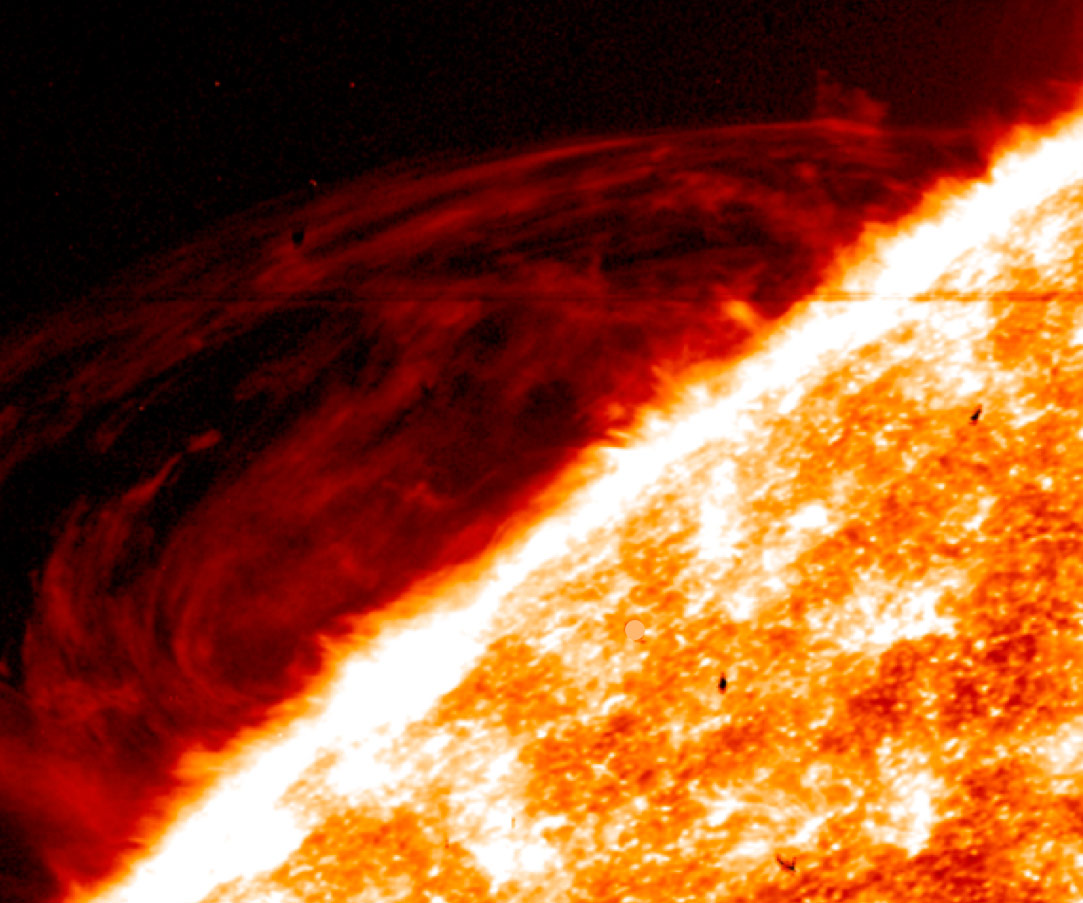
DePontieu has been culling images of two particular types of events on the sun that have long been interesting to scientists. One is known as a prominence, which are cool regions within the interface region that appear as giant loops of solar material rising up above the solar surface. When these prominences erupt they lead to solar storms that can reach Earth. IRIS shows highly dynamic and finely structured flows sweeping throughout the prominence.
The second type of event is called a spicule, which are giant fountains of gas – as wide as a state and as long as Earth – that zoom up from the sun’s surface at 150,000 miles (240,000 kilometers) per hour. Spicules may play a role in distributing heat and energy up into the sun’s atmosphere, the corona. IRIS imaging and spectral data allow us to see at high resolution, for the first time, how the spicules evolve. In both cases, observations are more complex than what existing theoretical models predicted.
This movie shows a numerical simulation of a small area of the solar atmosphere at ~10,000K. Numerical models bridge the gap between IRIS observations and the physical mechanisms driving solar events and dynamics. Credit: NASA/LMSAL/IRIS
“We see discrepancies between these observations and the models and that is great news for advancing knowledge,” said Mats Carlsson, an astrophysicist at the University of Oslo in Norway. “By seeing something we don’t understand we have a chance of learning something new.”
Carlsson helps support the crucial computer model component of IRIS’ observations. The computer models require an intense amount of power. Modeling just an hour of events on the sun can take several months of computer time. IRIS relies on supercomputers at NASA’s Ames Research Center in Moffett Field, California, the Norwegian supercomputer collaboration, and the Partnership for Advanced Computing in Europe.
Such computer models had helped design the IRIS instruments by providing a basis for the instrument performance requirements. Currently, they are used for analysis of IRIS data, as they represent the state of knowledge about what scientists understand about the interface region. By comparing models with actual observations, researchers figure out where the models fail, and therefore where the current state of knowledge is not complete.
By filling in these gaps, IRIS observations are helping round out our images of the solar atmosphere. The Japanese Aerospace Exploration Agency/NASA Hinode mission provides detailed imagery of the solar surface. NASA’s Solar Dynamics Observatory offers imagery of what’s higher up in the corona. Now, IRIS provides unprecedented information about the crucial layer in between, to finally help us understand how energy moves through the lower levels of the solar atmosphere driving the solar wind and heating the corona.
The movie on the right side shows the prominence motions of material at 65,000K. The vertical stripe in the center of the image is the entrance slit for the spectrograph part of the instrument. The left movie shows the resulting spectrum of material at 10,000k. Credit: NASA/LMSAL/IRIS
The IRIS Observatory was designed and the mission is managed by Lockheed Martin. The Harvard-Smithsonian Center for Astrophysics in Cambridge, Massachusetts, built the telescope. Montana State University in Bozeman, Montana designed the spectrograph. NASA Ames provides mission operations and ground data systems. NASA’s Goddard Space Flight Center, in Greenbelt, Maryland manages the Small Explorer Program for NASA’s Science Mission Directorate in Washington, D.C. The Norwegian Space Center is providing regular downlinks of science data. Other contributors include the University of Oslo and Stanford University in Stanford, California.
Related Links:
› AGU – IRIS Presentation
› NASA’s IRIS website
Never miss a breakthrough: Join the SciTechDaily newsletter.
Follow us on Google and Google News.