The extent of winter sea ice surrounding Antarctica is in uncharted territory in the satellite record.
Antarctica is experiencing the depths of winter, yet the continent is surrounded by significantly less sea ice than scientists anticipated for this time of year. Throughout July 2023, sea ice averaged 13.5 million square kilometers (5.2 million square miles), marking the lowest extent observed for this time of year since the continuous satellite record began in late 1978.
Sea Ice Observations
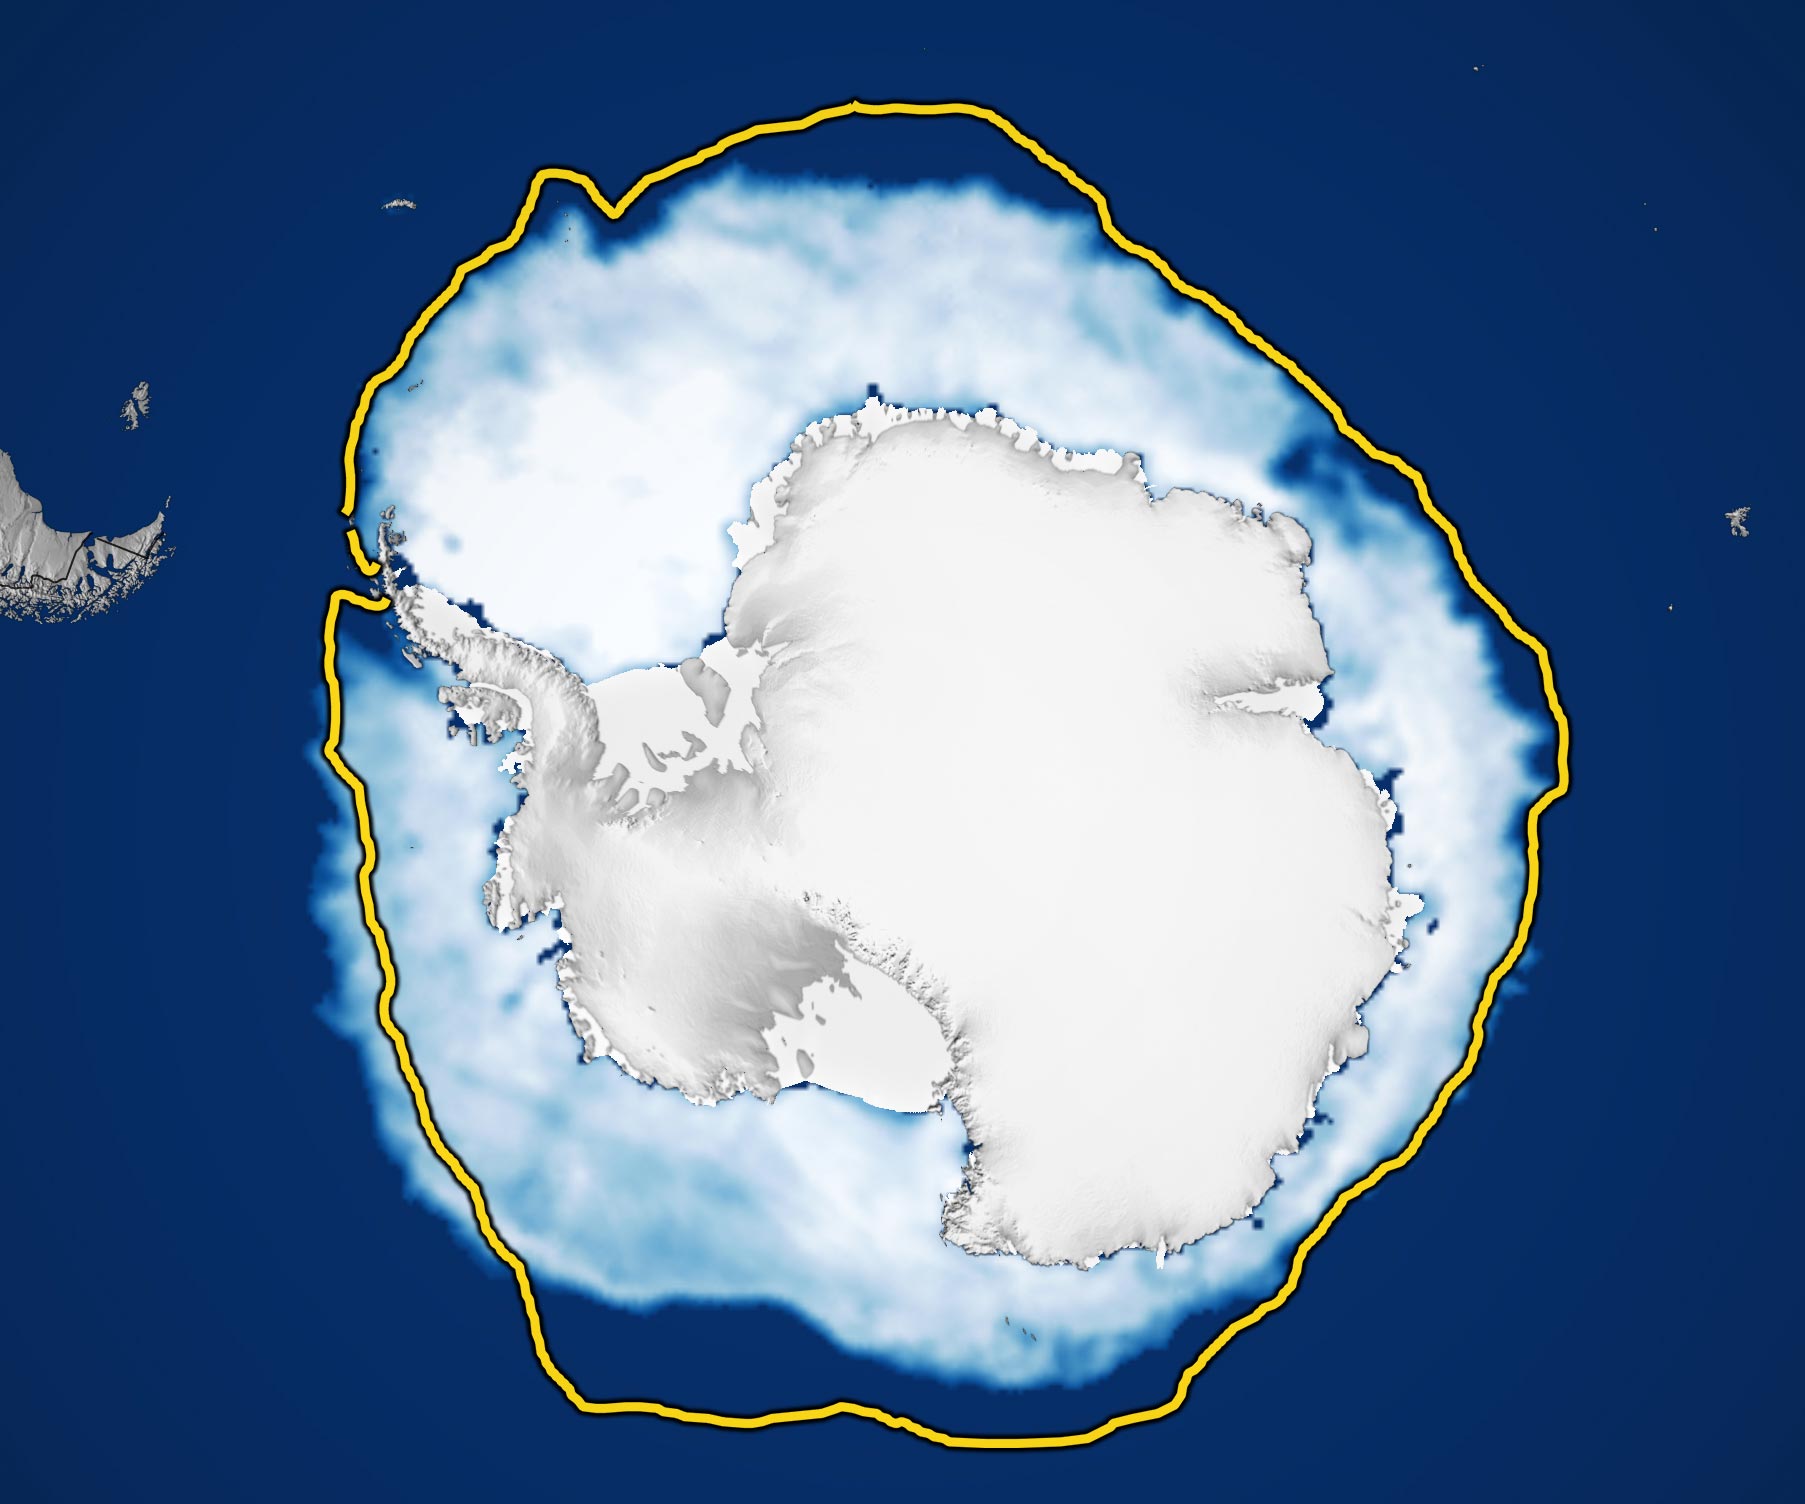
The map above shows the extent of Antarctic sea ice on August 7, 2023, based on satellite data maintained by the National Snow and Ice Data Center (NSIDC), one of NASA’s Distributed Active Archive Centers.
Antarctic sea ice follows a seasonal trend, and each year, some 15 million square kilometers of ice grows and melts. Ice growth this winter has been very slow. In July, sea ice covered about 2 million square kilometers (an area the size of Mexico) less than the 1981 to 2010 average. The yellow line shows the median sea ice extent for July from 1981 to 2010.
Regions of Low Ice Extent
The map indicates that ice extent was low nearly everywhere around the continent. Specific areas of low ice extent included the northeastern Weddell Sea, northern Ross Sea, and eastern Bellingshausen Sea. Interestingly, the Amundsen Sea was the only area with above-average extent.
“What we’re seeing this year is uncharted territory in the satellite record,” said Walt Meier, a sea ice scientist at NSIDC. According to NSIDC, the average sea ice extent in July 2023 was 1.5 million square kilometers (579,000 square miles) lower than the previous record-low July extent seen in 2022. The chart below shows the daily sea ice extent through August 7, 2023 (red) compared to the 2022 record low (orange) and the average extent from 1981 to 2010 (blue).
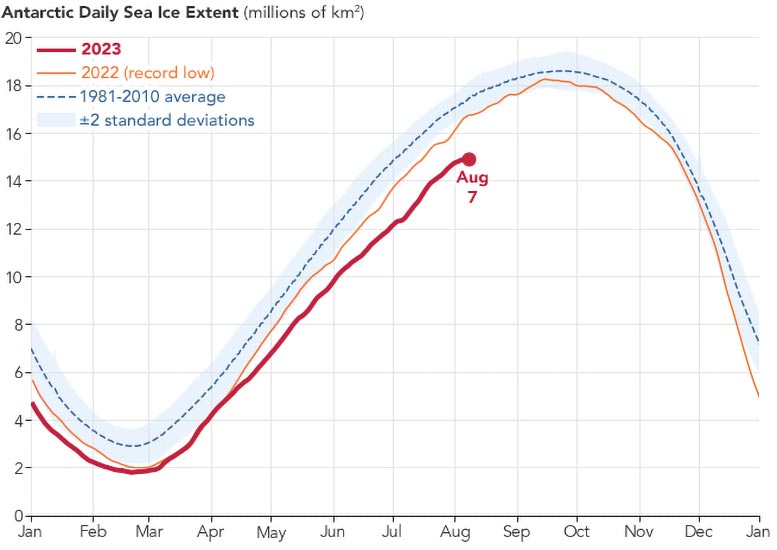
Downward Trend
This record-low extent so far in 2023 is a continuation of a downward trend in Antarctic sea ice that started following a record high in 2014. Prior to 2014, ice surrounding the continent was increasing slightly over the long term (about 1 percent per decade). But since then, it has taken a sharp decline, with record lows in 2017, 2022, and now 2023. “Most of the months since 2016 have been well below average,” Meier said. The cause of this shift is not yet clear to scientists.
Scientific Perspectives and Research
“Both the increase in Antarctic sea ice prior to 2014 and its rapid decrease since are of great interest to scientists, without a consensus point-of-view on the drivers,” said Claire Parkinson, a climate scientist at NASA’s Goddard Space Flight Center. Parkinson is an expert in using satellite observations to map sea ice extent, and in 1983 she was part of the group that published the first atlas of Antarctic sea ice from satellite data.
Parkinson’s recent research found that the rate of sea ice decline around Antarctica between 2014 and 2017 far exceeded the declines seen in Arctic sea ice in recent years, and was a much greater decline than anything observed in the entire 40-year satellite record.
Speculations and Future Studies
Some scientists are speculating whether the sudden reversal in Antarctic sea ice indicates a shift toward generally lower ice extent. While Meier asserted it was too early to determine whether this is the case, recent studies suggest changing ocean conditions could be a factor. Ocean heat may be playing a stronger role in limiting autumn and winter ice growth and enhancing spring and summer melting.
NASA Earth Observatory images by Lauren Dauphin, using data from the National Snow and Ice Data Center.
Never miss a breakthrough: Join the SciTechDaily newsletter.
Follow us on Google and Google News.
2 Comments
” Ocean heat may be playing a stronger role in limiting autumn and winter ice growth and enhancing spring and summer melting.”
Interestingly, the NASA July map showing anomaly temperatures shows an isolated warm pool near the Antarctic archipelago — right where this map shows shelf ice to be widest and most uniform. Perhaps the issue is winds moving the ice rather than melting it, as others have suggested!
Why is this map comparing the August 7th extent of shelf ice with the July average?