Decades of advances in satellite observation made it seem as though Arctic snow cover was growing, when in reality satellites were simply becoming better at detecting smaller and shrinking amounts of snow.
For many years, reports from the United Nations’ Intergovernmental Panel on Climate Change (IPCC) have summarized how Earth’s climate is changing.
New research from the University of Toronto, however, suggests that some of the data behind these assessments does not fully capture an important factor driving rapid warming in the Arctic.
Snow data shapes Arctic conclusions
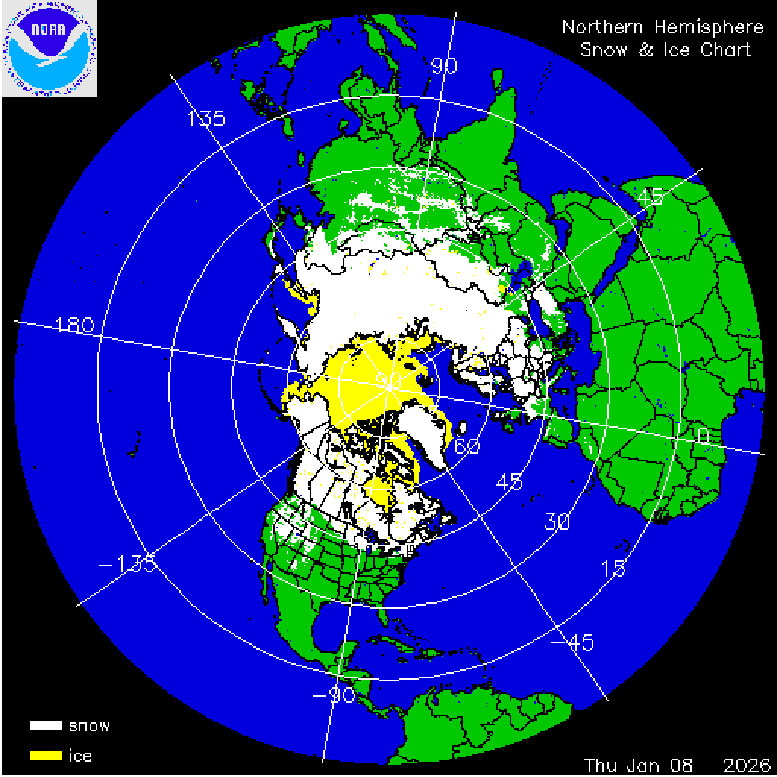
IPCC assessments draw on many sources of climate information, including long-running records from the U.S. National Oceanic and Atmospheric Administration (NOAA) that track autumn snow cover in the Northern Hemisphere. Snow cover refers to how much land area is blanketed by snow, and these measurements have been collected every year since the 1960s.
Snow cover matters because it plays a major role in regulating Earth’s temperature. Snow reflects a large share of incoming energy back into space, while darker land surfaces and vegetation absorb much more heat. In general, snow reflects about 80 percent of incoming energy, compared with less than 50 percent for land and plants.
“Snow cover is important because it’s a positive climate feedback mechanism,” explains Aleksandra Elias Chereque, a PhD student in the department of physics in U of T’s Faculty of Arts & Science.
“This is referred to as the snow-albedo effect—albedo meaning reflectivity. Snow loss leads to a decrease in albedo, which leads to higher energy absorption, which, in turn, leads to enhanced snow loss. This is a contributing factor to a phenomenon known as ‘Arctic amplification,’ and it’s why we observe a disproportionate amount of heating in the Arctic.”

A long-standing data discrepancy
Despite the importance of these measurements, scientists have questioned the reliability of the NOAA snow cover record for years. The trends suggested by the data did not align well with other observations, leading many researchers to warn that the results should be interpreted carefully.
Elias Chereque and her colleagues have now confirmed those concerns through a detailed reanalysis of the NOAA data. The original observations indicated that snow cover across the Northern Hemisphere increased by about 1.5 million square kilometers per decade, an area roughly one and a half times the size of Ontario.
The new analysis tells a very different story. Instead of growing, snow cover has been shrinking by about half a million square kilometers per decade, an area comparable to half the size of Canada’s most populous province.
Better satellites, misleading trends
Elias Chereque and her collaborators show that changes over the years in instrumentation and data collection methods in the NOAA data resulted in an increased sensitivity to thin snow cover and, thus, the erroneous observations that snow cover had increased.
“It’s as if the satellite’s ‘eyeglasses’ got better and better over that period,” says Elias Chereque. “It looks like there’s more snow now than there used to be – but that’s only because the satellite kept getting better ‘prescriptions for its glasses.’ It looked like there was more snow but that’s not what was happening.”
Correcting the record on Arctic warming
The study, published in the journal Science Advances, was co-authored by atmospheric physicist Paul Kushner, professor and chair in the department of physics and collaborators from the climate research division of Environment and Climate Change Canada. It adds evidence to the finding that snow cover is decreasing throughout the year and increases confidence in that result.
“We know snow loss is influenced by anthropogenic warming and snow loss also creates more potential for warming through the snow-albedo feedback, so we’ve gained a better understanding of this important mechanism of Arctic amplification,” Elias Chereque says.
“Showing how and why the snow cover trend was wrong helps us learn how to use this data set properly when we’re estimating past conditions and future trends. And that helps in understanding whether climate models are accurate.
“Developing tools like this helps us better understand climate and make better predictions about the future.”
Reference: “Determining the cause of inconsistent onset-season trends in the Northern Hemisphere snow cover extent record” by Aleksandra Elias Chereque, Paul J. Kushner, Lawrence Mudryk and Chris Derksen, 31 October 2025, Science Advances.
DOI: 10.1126/sciadv.adv7926
This work was supported by the National Sciences and Engineering Research Council of Canada and the Canadian Space Agency grant 16SAUSSNOW (P.J.K.).
Never miss a breakthrough: Join the SciTechDaily newsletter.
Follow us on Google and Google News.
8 Comments
“Decades of advances in satellite observation made it seem as though Arctic snow cover was growing, when in reality satellites were simply becoming better at detecting smaller and shrinking amounts of snow.”
If the discrepancy in the 85% ice-coverage estimate is a result of increasing spatial resolution of the satellites, the solution is simple: simply re-sample the imagery so that the pixels in all imagery represent the same distance on the surface. If that wasn’t done, one has to ask “Why not?”
“This is referred to as the snow-albedo effect—albedo meaning reflectivity. Snow loss leads to a decrease in albedo, which leads to higher energy absorption, which, in turn, leads to enhanced snow loss. This is a contributing factor to a phenomenon known as ‘Arctic amplification,’ and it’s why we observe a disproportionate amount of heating in the Arctic.”
One usually reads about this with respect to the loss of pack ice in the Arctic. However, that argument is weak because while the diffuse reflectance (albedo) from snow is about 80% or less, the specular reflection off open water varies with the angle of incidence and reaches 100% at the terminator. The north is well-known for the numerous small lakes and streams. Except for the special areas of sun glint, most of the light reflected off meltwater sitting on top of ice is not going to be observed by a nadir-viewing satellite.
Accurately measuring snow coverage is not a trivial task because where there are boreal conifers there are dense shadows falling to the sides; farther south, where one finds deciduous trees, from about May through September, leaves hide remaining snow and increase shadows. This is a problem of what is called thematic classification — identifying the different classes of surface coverage. With older multispectral classification, such as Landsat, shadows (as well as sub-pixel patches of snow) are a component of what is called a ‘mixed pixel.’ As spatial resolution increases, the shadows (and snow) separate out and become a distinct class, which if too dark, may be incapable of classifying properly. A study I was involved with for the City of Scottdale (AZ) was attempting to measure permeable and impermeable surfaces in the desert and urban areas with supervised classification. Somewhat surprisingly, patches of creosote plants typically classified as dark asphalt because of the strong shadows under the plants.
If today’s satellites that are being used for snow cover assessment have higher spatial resolution than the older ones, they will be classifying smaller patches of snow, particularly near peak melting, leading to higher estimates of total snow. Calibration studies need to be done before one can have confidence in the “reanalysis” conclusions. Also, what is notably missing from the published research is an error-matrix of the false-positives and false-negatives of the thematic classes, as per Congalton & Green.
If those monitoring the snow pack for decades have been doing it improperly, I don’t have confidence that they have suddenly found how to do it properly. It takes experts with experience.
Does NOAA concur with this? How can you prove the enhanced sensitivity of satellite sensors leads to counting more thinner patches of snow? Intuitively that is backward. Take a piece of dark paper and cover 2/3 of it with white dots. From across the room with high zoom it looks white in a photo. . Now get close and take a picture and you can see a good portion is not white. The improved sensitivity can produce apparent decrease in snow cover.
Your proposed experiment will discriminate both snow and low-reflectance cover for situations where the majority of a pixel is one or the other; one could try to discriminate more exactly by calculating what the digital number should be for a mixed pixel assuming only 50% and 85% components. Unfortunately, things become less certain if the coarse mixed pixel contains both shadow and sun glint. Coarse resolution will only show a change in the digital number for a mixed pixel.
If all we have been lied to is because the machines used have improved, will not the same argument be used in another 20+ years.
Where did I say that “we have been lied to?” If anything, I’m suggesting incompetence, not duplitiousness.
What’s happening (roughly) is that the counting algorithm divides the satellite photo into a grid, and then calls each square in the grid “snow” or “not snow”, based on previously defined characteristics. Then it counts each square and gives the results.
But as the grid squares get smaller, the overall accuracy gets better, and it’s possible that the sensors are better at counting vs the definitions provided.
Imagine that the smaller grid squares allow more precise definition of “snow”, because the measurement meets more precise conditions, as opposed to “Snow” equals “any square with more than 75% white”, which doesn’t deal as well with edge cases.
“But as the grid squares get smaller, the overall accuracy gets better, …”
Hopefully, that would be the case, which is what drives increasing spatial resolution. However, as I mentioned above, going to higher spatial resolution often results in introducing a ‘shadow’ class where there is less certainty about the ground cover because shadows move with the sun and the dark areas have a lower signal-to-noise ratio. As is usual in the real world, there are invariably confounding factors.