Scientists have created the first-ever 3D maps of star-forming molecular clouds near the Milky Way’s supermassive black hole, revealing how past flares from Sagittarius A* interacted with surrounding gas.
By using a groundbreaking X-ray tomography technique, they’ve reconstructed the hidden structures of these clouds, shedding light on their role in star formation and galactic evolution. This work not only uncovers secrets of our Galaxy’s violent past but also provides a powerful tool for studying similar extreme environments in other galaxies.
Mapping the Most Extreme Star-Forming Regions
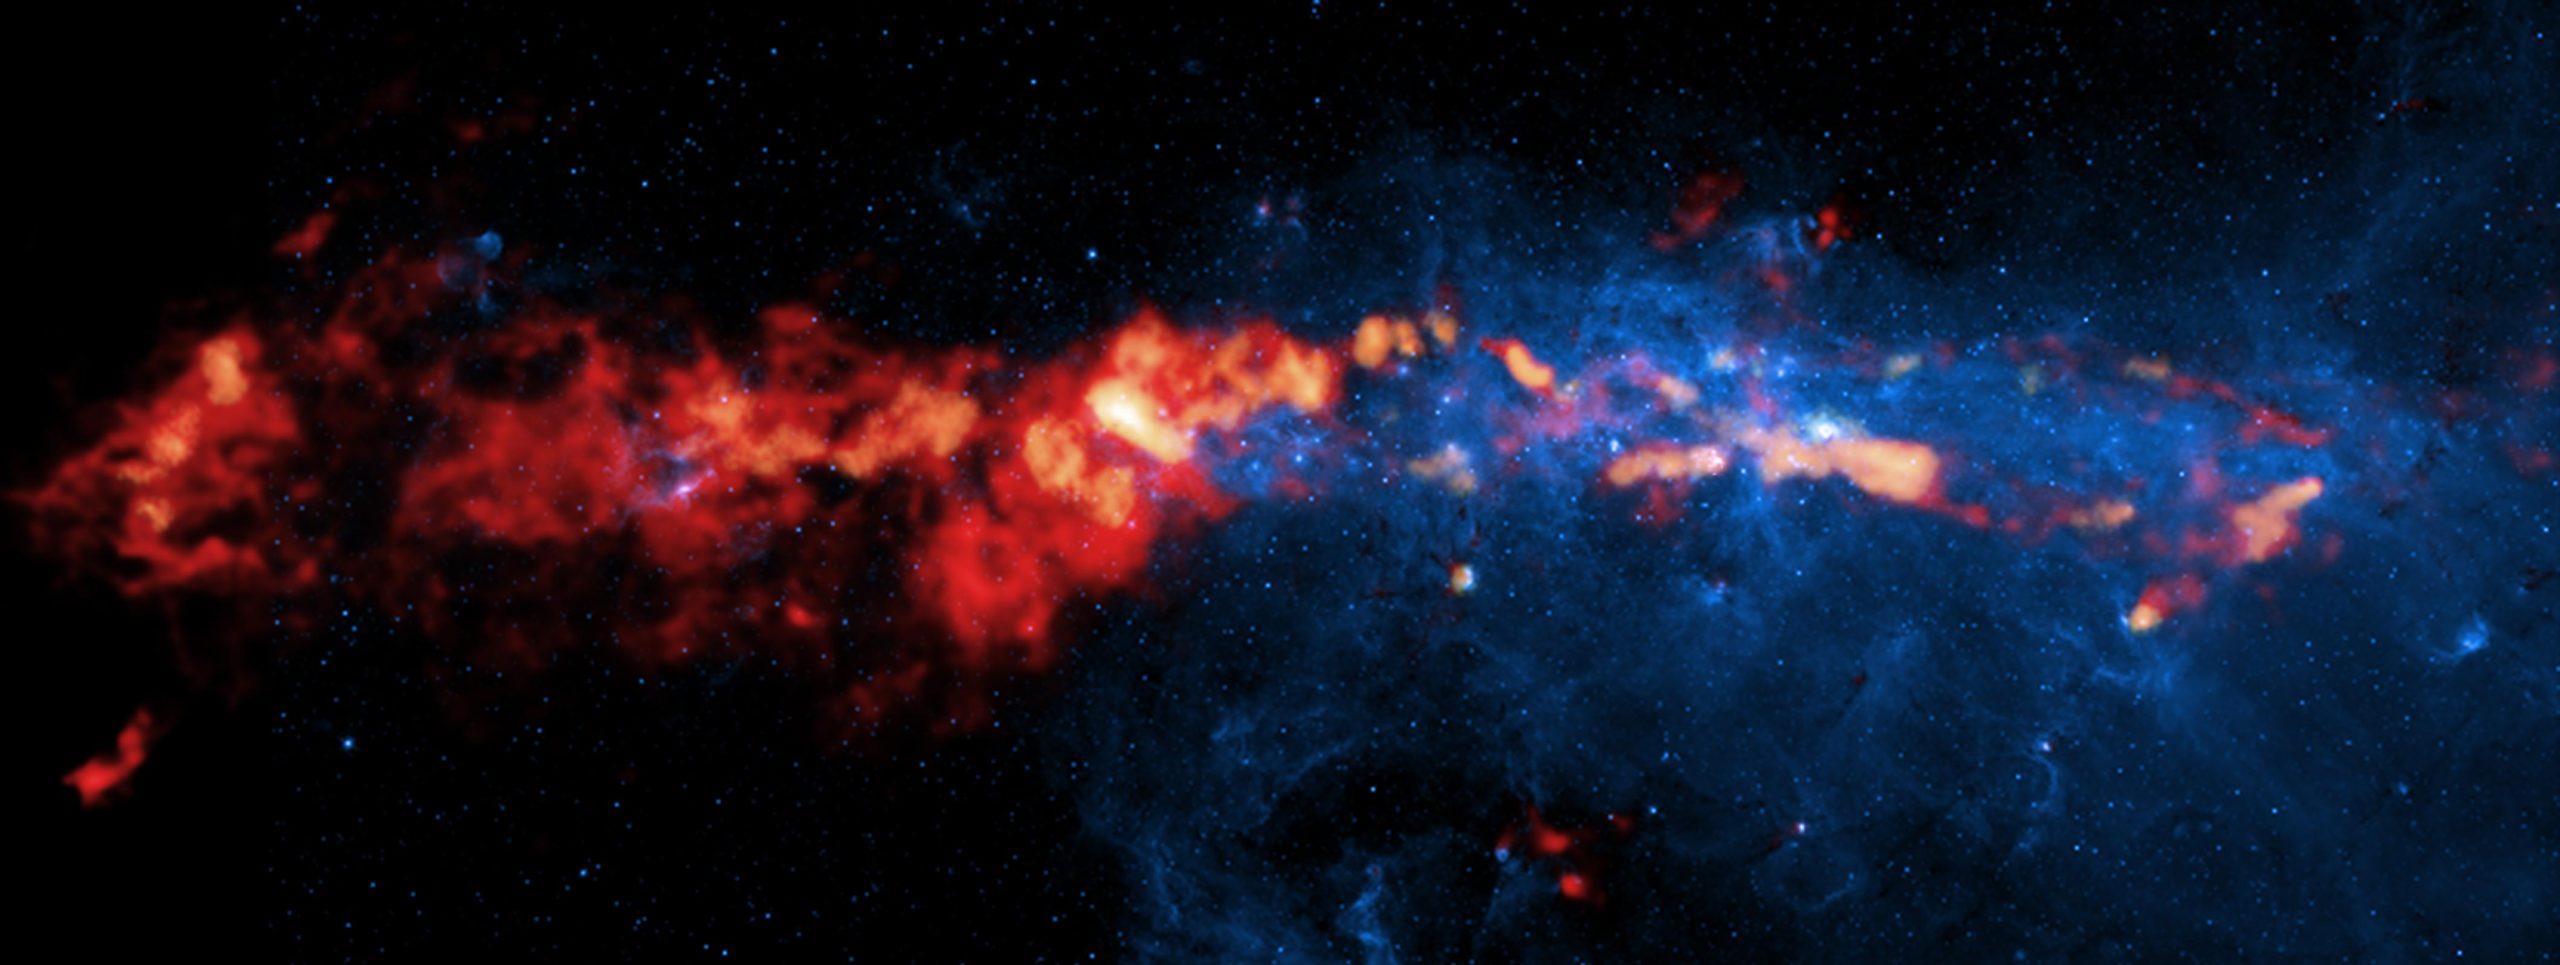
Researchers at the University of Connecticut have created the first-ever 3D maps of star-forming gas clouds in one of the most extreme regions of our galaxy. They have also studied past flaring events from the Milky Way’s supermassive black hole, Sagittarius A* (Sgr A*).
The center of the Milky Way is an exceptionally turbulent environment, where gas temperatures, densities, and movement are about ten times more intense than in the rest of the galaxy. Occasionally, inflowing gas reaches Sgr A*, triggering powerful X-ray flares that radiate outward in all directions. These flares interact with nearby molecular clouds — dense gas clouds where new stars form — through a process called fluorescence. As the X-ray light moves through space, it illuminates different layers of these clouds over time, much like an X-ray scan revealing internal structures.

New X-ray Tomography Unlocks Hidden Structures
University of Connecticut Physics Researcher Danya Alboslani ’24 (CLAS) and postdoctoral researcher Dr. Samantha Brunker, part of the Milky Way Laboratory led by Associate Professor of Physics Cara Battersby, developed a new X-ray tomography method to make 3D maps of two Galactic Center molecular clouds dubbed the “Stone” and the “Sticks” clouds.
These maps are the first-ever renderings of Galactic Center molecular clouds in three spatial dimensions. Alboslani detailed this research in her presentation “X-ray echoes from Sgr A* reveal the 3D structure of molecular clouds in the Galactic Center” at the 245th meeting of the American Astronomical Society (AAS) in National Harbor, Maryland on January 14th. Two manuscripts have been submitted to AAS Journals and are available on arXiv.

Using the Milky Way as a Cosmic Laboratory
“We can study processes in the Milky Way’s Central Molecular Zone (CMZ) and use our findings to learn about other extreme environments. While many distant galaxies have similar environments, they are too far away to study in detail. By learning more about our own Galaxy, we also learn about these distant galaxies that cannot be resolved with today’s telescopes,” says Alboslani.
Alboslani explains that Sgr A* has gone through periods of intense activity in the past when it emitted X-ray flares. We did not have X-ray telescopes when those X-ray flares first came to Earth, however the X-ray light interacted with molecular clouds in the CMZ.
“The cloud absorbs the X-rays that are coming from Sgr A* then re-emits X-rays in all directions. Some of these X-rays are coming towards us, and there is this very specific energy level, the 6.4 electron volt neutral iron line, that has been found to correlate with the dense parts of molecular gas,” says Alboslani.
“If you imagine a black hole in the center producing these X-rays which radiate outwards and eventually interact with a molecular cloud in the CMZ, over time, it will highlight different parts of the cloud, so what we’re seeing is a scan of the cloud.” Since the Galactic Center is filled with large amounts of dust, the visible light may be obscured, but the X-rays emitted by Sgr A* during intense accretion events can be seen.
Decoding the Mysterious X-ray Signals
Alboslani’s paper focuses on a Galactic Center molecular cloud called the Stone cloud, while Brunker’s paper studies the Sticks cloud. “The overall morphological agreement, and in particular, the association of the densest regions in both X-ray and molecular line data is striking and is the first time it has been shown on such a small scale,” says Brunker.
Alboslani and Brunker used data from NASA’s Chandra X-ray Observatory spanning two decades to create their 3D models of the Stone and Sticks molecular clouds. Battersby explains that while we typically only see two spatial dimensions of objects in space, the X-ray tomography method allows us to measure the third dimension of the cloud because we see the X-rays illuminate individual slices of the cloud over time. “We can use the time delay between illuminations to calculate the third spatial dimension because X-rays travel at the speed of light,” Battersby explains.
A New Way to Reconstruct the Past
Alboslani and Brunker also used data from the Submillimeter Array and Herschel Space Observatory to compare the structures seen in the X-ray echoes to those seen in other wavelengths. Because X-ray data is not collected continuously, there are some structures seen in submillimeter wavelengths that are not seen in X-rays. However, they use these “missing” structures to constrain the duration of the X-ray flare event illuminating the Stone Cloud.
“We can estimate the sizes of the molecular structures that we do not see in the X-ray,“ says Brunker, “and from there we can place constraints on the duration of the X-ray flare by modeling what we would be able to observe for a range of flare lengths. The model that reproduced observations with similar sized ‘missing structures’ indicated that the X-ray flare couldn’t have been much longer than 4-5 months.”
Unraveling the Secrets of Star Formation
“While we learn a lot about molecular clouds from data collected in 2D, the added third dimension allows for a more detailed understanding of the physics of how new stars are born,” says Battersby. “Additionally, these observations place key constraints on the global geometry of our Galaxy’s Center as well as the past flaring activity of Sgr A*, central open questions in modern astrophysics.”
The Future of 3D Astrophysical Mapping
Pioneering approaches like this method to model molecular clouds in 3D are helping researchers glean more information about the conditions that lead to star formation. Another exciting aspect of this work is that it presents a new way to use archival data, says Alboslani,
“New instruments and telescopes launched in the future will provide astronomers with higher resolution, allowing us to study objects in more detail. However, we can also look back in time and study objects over longer periods to extract new information-which is what this project does.”
References:
“3D MC I: X-ray Tomography Begins to Unravel the 3-D Structure of a Molecular Cloud in our Galaxy’s Center” by Samantha W. Brunker, Cara Battersby, Danya Alboslani, Maïca Clavel, Daniel L. Walker, Dani Lipman, H Perry Hatchfield and Régis Terrier, 13 January 2025, Astrophysics > Astrophysics of Galaxies.
arXiv:2501.07717
“3D MC II: X ray echoes reveal a clumpy molecular cloud in the CMZ” by Danya Alboslani, Cara Battersby, Samantha Brunker, Maïca Clavel, Daniel Walker and Dani Lipman, 13 January 2025, Astrophysics > Astrophysics of Galaxies.
arXiv:2501.07669
This research was supported by funding from NASA (Grant No. 80NSSC22K1125), the University of Connecticut’s Summer Undergraduate Research Fund Award and Research Travel Award from the Office of Undergraduate Research, and the Centre National d’Études Spatiales (CNES).
Never miss a breakthrough: Join the SciTechDaily newsletter.
Follow us on Google and Google News.
1 Comment
===≈≈≈
3.
Using 20 years of data collected at NASA’s Chandra X-ray Observatory, Alvoslani and Brunker created 3D models of Stone and Sticks molecular clouds. Battersby explains that while typically only two spatial dimensions of an object can be seen in space, X-ray tomography can measure the third dimension of the cloud because it can see X-rays illuminate individual slices of the cloud over time.
Battersby explains [3]”The third spatial dimension can be calculated using the time delay between lights, as X-rays travel at the speed of light.”
_[3]If time delay is used, does X-ray come out in a new dimension at the speed of light?
If 4 with ambiguity is 1 on the left and time is slow, will there be an order of movement and will it be firm like see 1?
a.
1111 Ambiguity
b.
Time delay
c.
1000 firmness
0010
0001
0100
d.
Truthfulness, truthfulness justice (*)
Integrity appears in future probability when time delay mobility is used for an ambiguity element. This is defined as truth (*).
3-1.A new way to reconstruct the past
Using data from the submillimeter array and Herschel Space Observatory, Alvoslani and Brunker also compared the structure seen in X-ray echoes to that seen at other wavelengths. Since X-ray data are not continuously collected, some of the structures seen at submillimeter wavelengths are not visible from X-rays. However, they use these “missing” structures to constrain the duration of X-ray flare events illuminating the Stone Cloud.
“We can estimate the size of the molecular structure invisible to X-rays,” says Brunker. “And there we can model what we can observe for different flare lengths to place constraints on the duration of X-ray flares. Models reproducing observations with similar sizes of ‘missing structures’ indicated that X-ray flares would not have been much longer than four to five months.”
_[3-1]】1334 is a 1234 ambiguity that is just spins, assuming that there is an order size in the center of the galaxy observed by x-rays. How they need to be viewed as 3d, which has a connection, so when I looked up the location, there could be spins between 1 and 2. Connecting them up to 16 showed a solidity of seeing 1. in the center of a galaxy. Uh-huh.
View 1.
04110613
14051203
15080902
01100716
NOTE 2502080501 Analysis during Summary_【
ㅡㅡㅡㅡㅡㅡㅡㅡㅡㅡㅡㅡㅡㅡ
Source 1.
https://scitechdaily.com/x-ray-echoes-unveil-the-hidden-3d-landscape-of-our-galaxys-heart/