New research shows that while some Antarctic ice shelves have been thinning since at least the 1970s, widespread thinning accelerated in the 1990s.
For many ice shelves around Antarctica, the 1970s was a bumpy decade. Fast forward, and satellite images show that many of the bumps once prominently visible on the surface of ice shelves have smoothed—implying that the shelves have become thinner and less stable.
The Role of Ice Shelves
An ice shelf is the extension of land-based ice—a tongue of a glacier that has stretched out from the coast and onto the surface of the ocean. Most of the planet’s ice shelves fringe Antarctica, where they play an important role in holding back, or buttressing, the flow of ice from inland and upstream. Such buttressing can slow the discharge of ice into the ocean and limit sea level rise. Thick, stable ice shelves perform this buttressing role most effectively.
Historical Perspective on Ice Shelf Thinning
Using satellite altimetry data collected since the 1990s, scientists previously found significant thinning on ice shelves in West Antarctica, the western Antarctic Peninsula, and parts of East Antarctica. Now Bertie Miles and Robert Bingham of the University of Edinburgh have looked even further back in time, using 50 years of imagery from Landsat satellites to extend our view of the changing continent.
Their research shows that the thinning underway between 1973 and 1989 was limited to small parts of ice shelves, mostly in the Amundsen Sea Embayment and the Wilkes Land coastline of East Antarctica. Then, from the 1990s onward, thinning spread rapidly. Their results were published on February 22 in Nature.
A Turning Point in the 1990s
The extended look back in time shows that the 1990s was a turning point. “While many previous studies have reported ongoing ice shelf thinning around Antarctica since the 1990s, we didn’t previously know that a lot of it started around then,” Bingham said.
Satellite altimetry data—measurement of the height of land and ice surfaces—was not available prior to the 1990s, so Miles and Bingham instead used optical images to track variations in the bumps on the ice surface. These bumps are surface expressions of pinning points—places where the floating ice shelf is anchored onto a high point of the seafloor. Pinning points are a useful indicator of ice shelf thickness: Bumps that become smaller or even smoothed out entirely over time indicate that an ice shelf had thinned and had possibly become unpinned.
“Bertie’s novel use of Landsat to map the unanchoring of pinning points serves as a proxy for ice shelf thickness change, alongside the more sophisticated altimetry methods the community has generally used,” Bingham said.
Pine Island Glacier: A Case Study
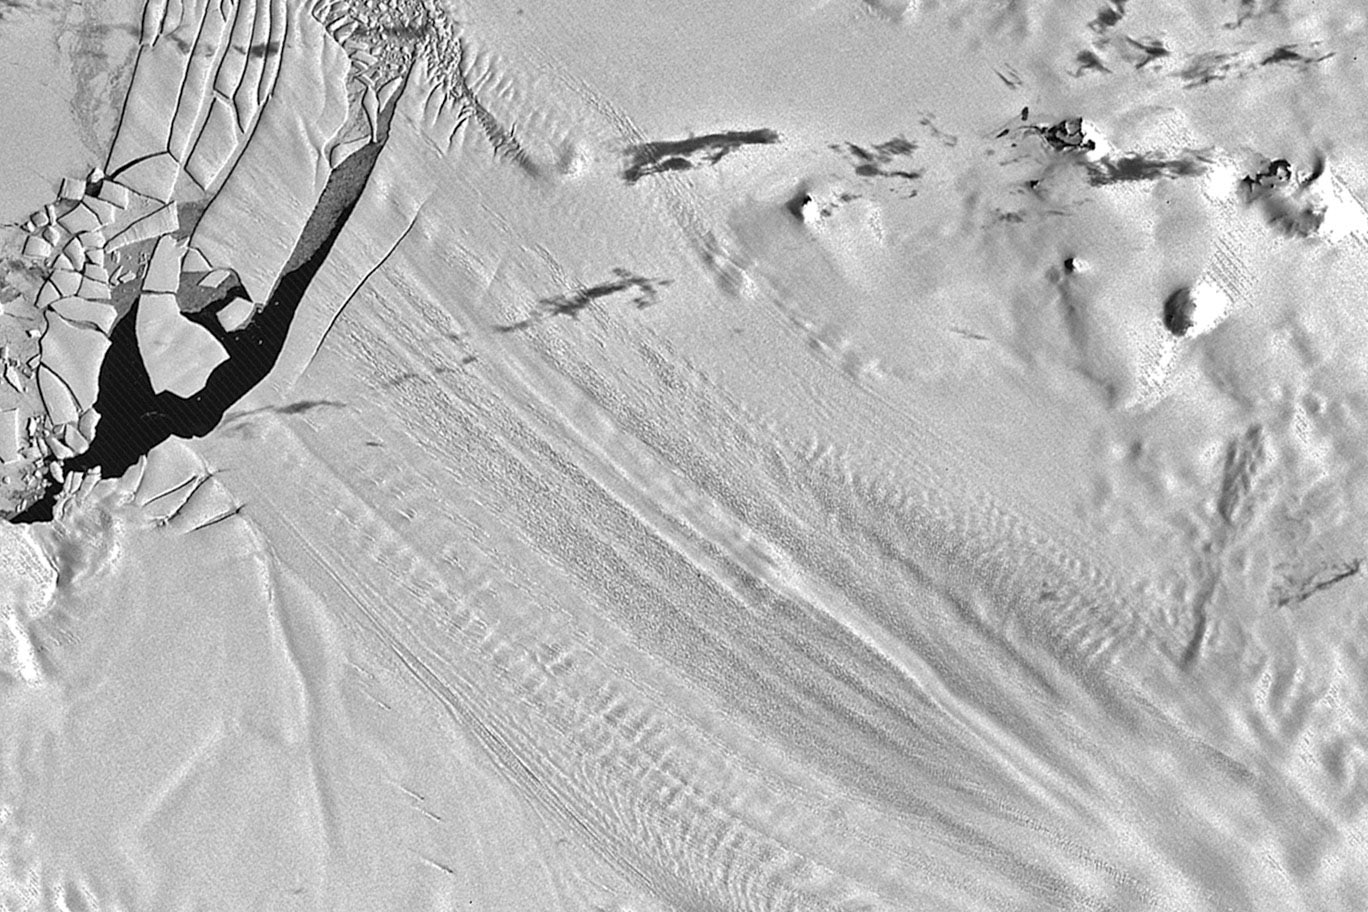
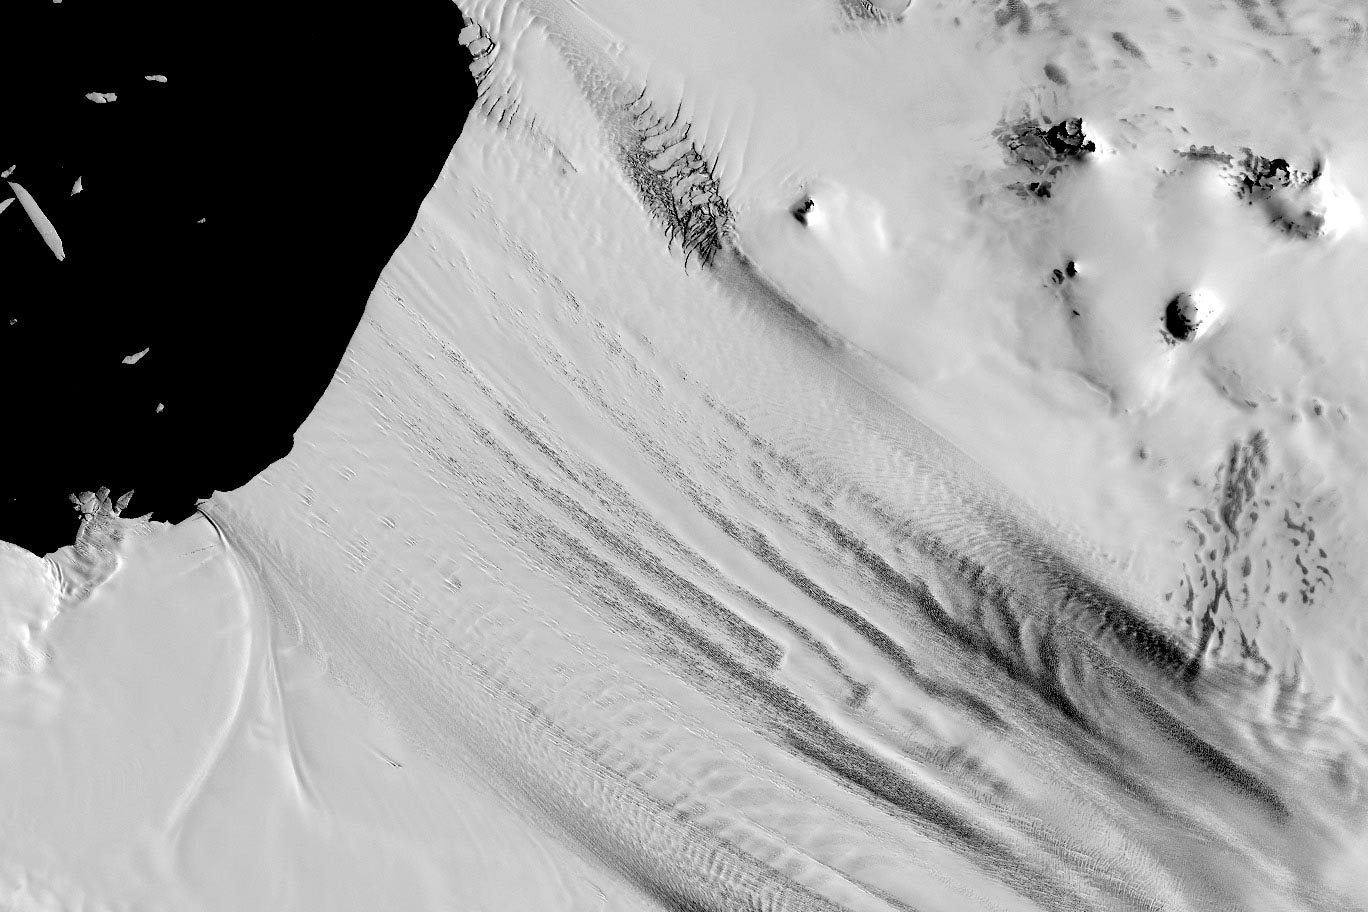
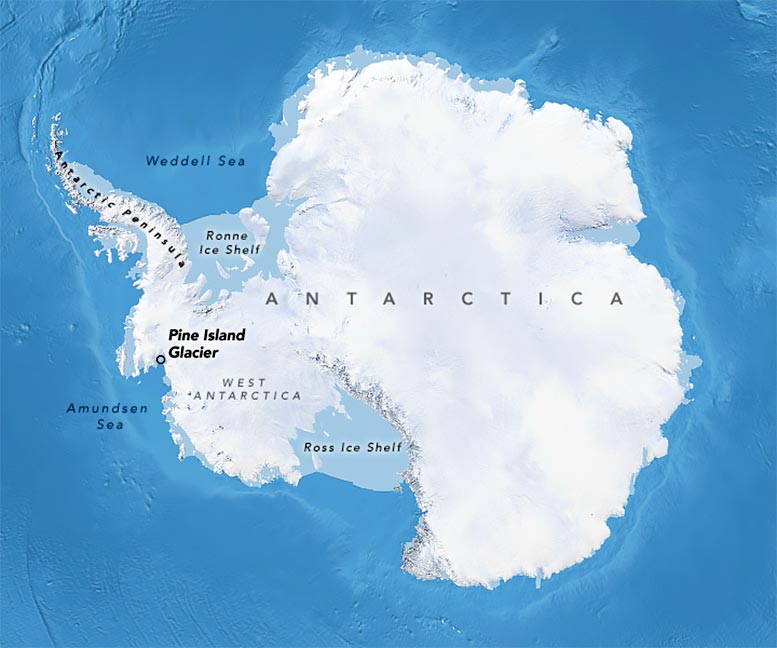
The image pair at the top of this page shows Pine Island Glacier, one of the regions in the Amundsen Sea Embayment where thinning was already underway in the 1970s. Several bumpy areas visible on the ice surface in January 1973 (upper) are mostly smooth in December 2001 (lower). Images were acquired with the MSS (Multispectral Scanner) on Landsat 1 (upper) and the ETM+ (Enhanced Thematic Mapper Plus) on Landsat 7 (lower). Note that the images use a grayscale palette to achieve a closer match between the different sensors.
“These images show the pinning points getting smaller through time as warm ocean currents melt the ice shelves, causing them to thin and subsequently unanchor from the seafloor highs,” Miles said.
Miles and Bingham’s findings confirmed that Pine Island Glacier was thinning sooner than most Antarctic ice shelves. Out of roughly 600 pinning points that the researchers tracked, only 15 percent shrank in size from 1973 to 1989, including those on Pine Island Glacier. That number grew to 25 percent between 1990 and 2000, and 37 percent between 2000 and 2022.
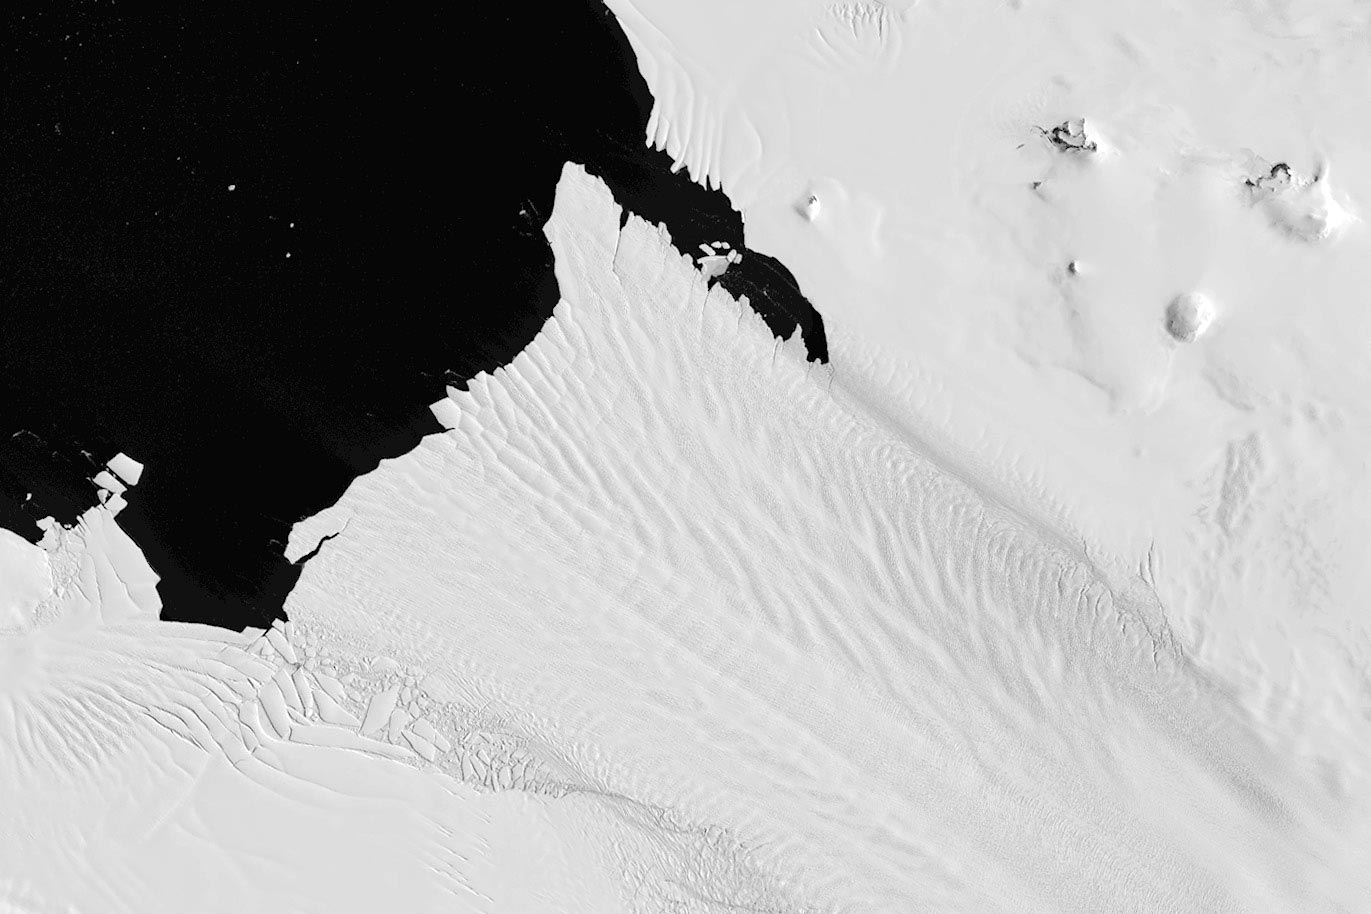
The image above, acquired with the OLI-2 (Operational Land Imager-2) on Landsat 9, shows Pine Island Glacier’s ice shelf in January 2024. By then, the smooth, thinning shelf had lost additional ice along its front and northern margin, and fractured ice was visible along the southern edge.
With Pine Island Glacier at or near the point of being completely unanchored, its ability to buttress ice has already been minimized. The “greater concern,” Miles and Bingham pointed out in their paper, might be the other major ice shelves that are still heavily anchored but showing signs of quickly losing their pinning points.
Reference: “Progressive unanchoring of Antarctic ice shelves since 1973” by Bertie W. J. Miles, and Robert G. Bingham, 21 February 2024, Nature.
DOI: 10.1038/s41586-024-07049-0
NASA Earth Observatory images by Wanmei Liang, using Landsat data from the U.S. Geological Survey and pinning point data from Miles, B.W.J., and Bingham, R.G.
Never miss a breakthrough: Join the SciTechDaily newsletter.
Follow us on Google and Google News.
3 Comments
Despite the terminus of the glacier obviously retreating over the last half-century, I’m left with the impression that the expression of topographic relief, particularly in the upper-right portion of the image, has become subdued, suggesting increased snow covering the features. As the Landsat technologies have progressed from 80m/pixel to 30m/pixel, one would expect the opposite apparent effect unless the newer imagery were re-sampled to match the original (1973) resolution. The authors apparently didn’t do that, instead choosing to just increase the apparent resolution of the early imagery to 60m/pixel with re-sampling. Might it be that the surface rumples from the presumed high “pinning” points have been buried by snow?
I’m uncertain about the effectiveness of point obstacles in restraining a glacier. If the shelf ice were grounded on a bedrock ridge, or a moraine from a former advance, I’d concede that it might slow the advance of the glacier some, which should be revealed by tension cracks downstream, and compression ridges upstream. However, if it is only a a point, I’d expect the ice to shear around the point, until such time as it erodes the obstacle. I’ve always been dubious about the effectiveness of the so-called “buttressing effect” of an ‘immovable object’ impeding an ‘irresistible force.’ There is plenty of geological evidence of continental glaciers shearing up and over or around an irregular topography, but ultimately smoothing it. A glacier’s forward movement is determined primarily by slope of the ground, and the friction between the ice and bedrock. A ‘pimple’ in the path won’t be very effective in reducing the forward motion of the entire glacier.
From the actual article, “Each image incorporated into the mosaic has a spatial resolution of 60 m.” This is an ambiguous statement. A resampling of the imagery to 60m/pixel from 80m/pixel is not the same as having a spatial resolution of 60m. Anyone working with modern Landsat imagery at the native sampling of ~30m/pixel knows that features that are smaller are discernible, especially linear features like roads, depending largely on the reflectance ratio between the background and the feature of interest. It is a phenomenon usually referred to as “mixed pixels.”
The southern side of the Pine Island Glacier shows interesting changes with time. The 2024 photo shows what appear to be frozen-in icebergs of large floes in contrast to the 1973 image showing crevassed but otherwise well-attached floating, presumably thicker, glacier.
Another observation is that 2 of the 3 ‘pinning points’ are on the edge of the glacier, where lateral moraines form — place where boulders and ice can accumulate from avalanches along the walls constraining the ice tongue. The third is located in what would be the medial moraine, where two lateral moraines merge.
It seems that the authors have assumed that there is a bedrock high-point without confirmation using drilling or ground-penetrating radar. They may well be large blocks of rock that have fallen on the surface, and subsequently sunken because of their weight and higher density than ice. Why are there ‘pinning points’ on the bedrock floor of a glacier capable of excavating a U-shaped channel like Yosemite? Once again, assumptions made without supporting evidence.