On the morning of June 23, 2020, a strong earthquake struck the southern state of Oaxaca, Mexico. The 7.4- magnitude earthquake prompted evacuations in the region, triggered a tsunami warning, and damaged thousands of houses. Satellite radar data, from the Copernicus Sentinel-1 mission, are being used to analyze the effects of the earthquake on land.
Mexico is one of the world’s most seismically active regions, sitting on top of three of Earth’s largest tectonic plates – the North American, Cocos, and Pacific. Near Mexico’s southern region, the North American plate collides with the Cocos plate, which is forced underground in a subduction zone. This geological process is associated with many of the damaging earthquakes on the Pacific coast of Mexico – including the most recent on 23 June.
The earthquake reported in the Oaxaca region occurred at 10:29 local time – with its epicenter located around 12 km southwest of Santa María Zapotitlán. Several powerful aftershocks were registered the same day, with five more recorded in the following 24 hours.
While there is currently no way to predict when earthquakes will occur, radar imagery from satellites allow for the effects of earthquakes to be observed. Since its launch, the Copernicus Sentinel-1 mission has proven a magnificent system to measure the surface deformation caused by tectonics, volcanic eruptions, and land subsidence.

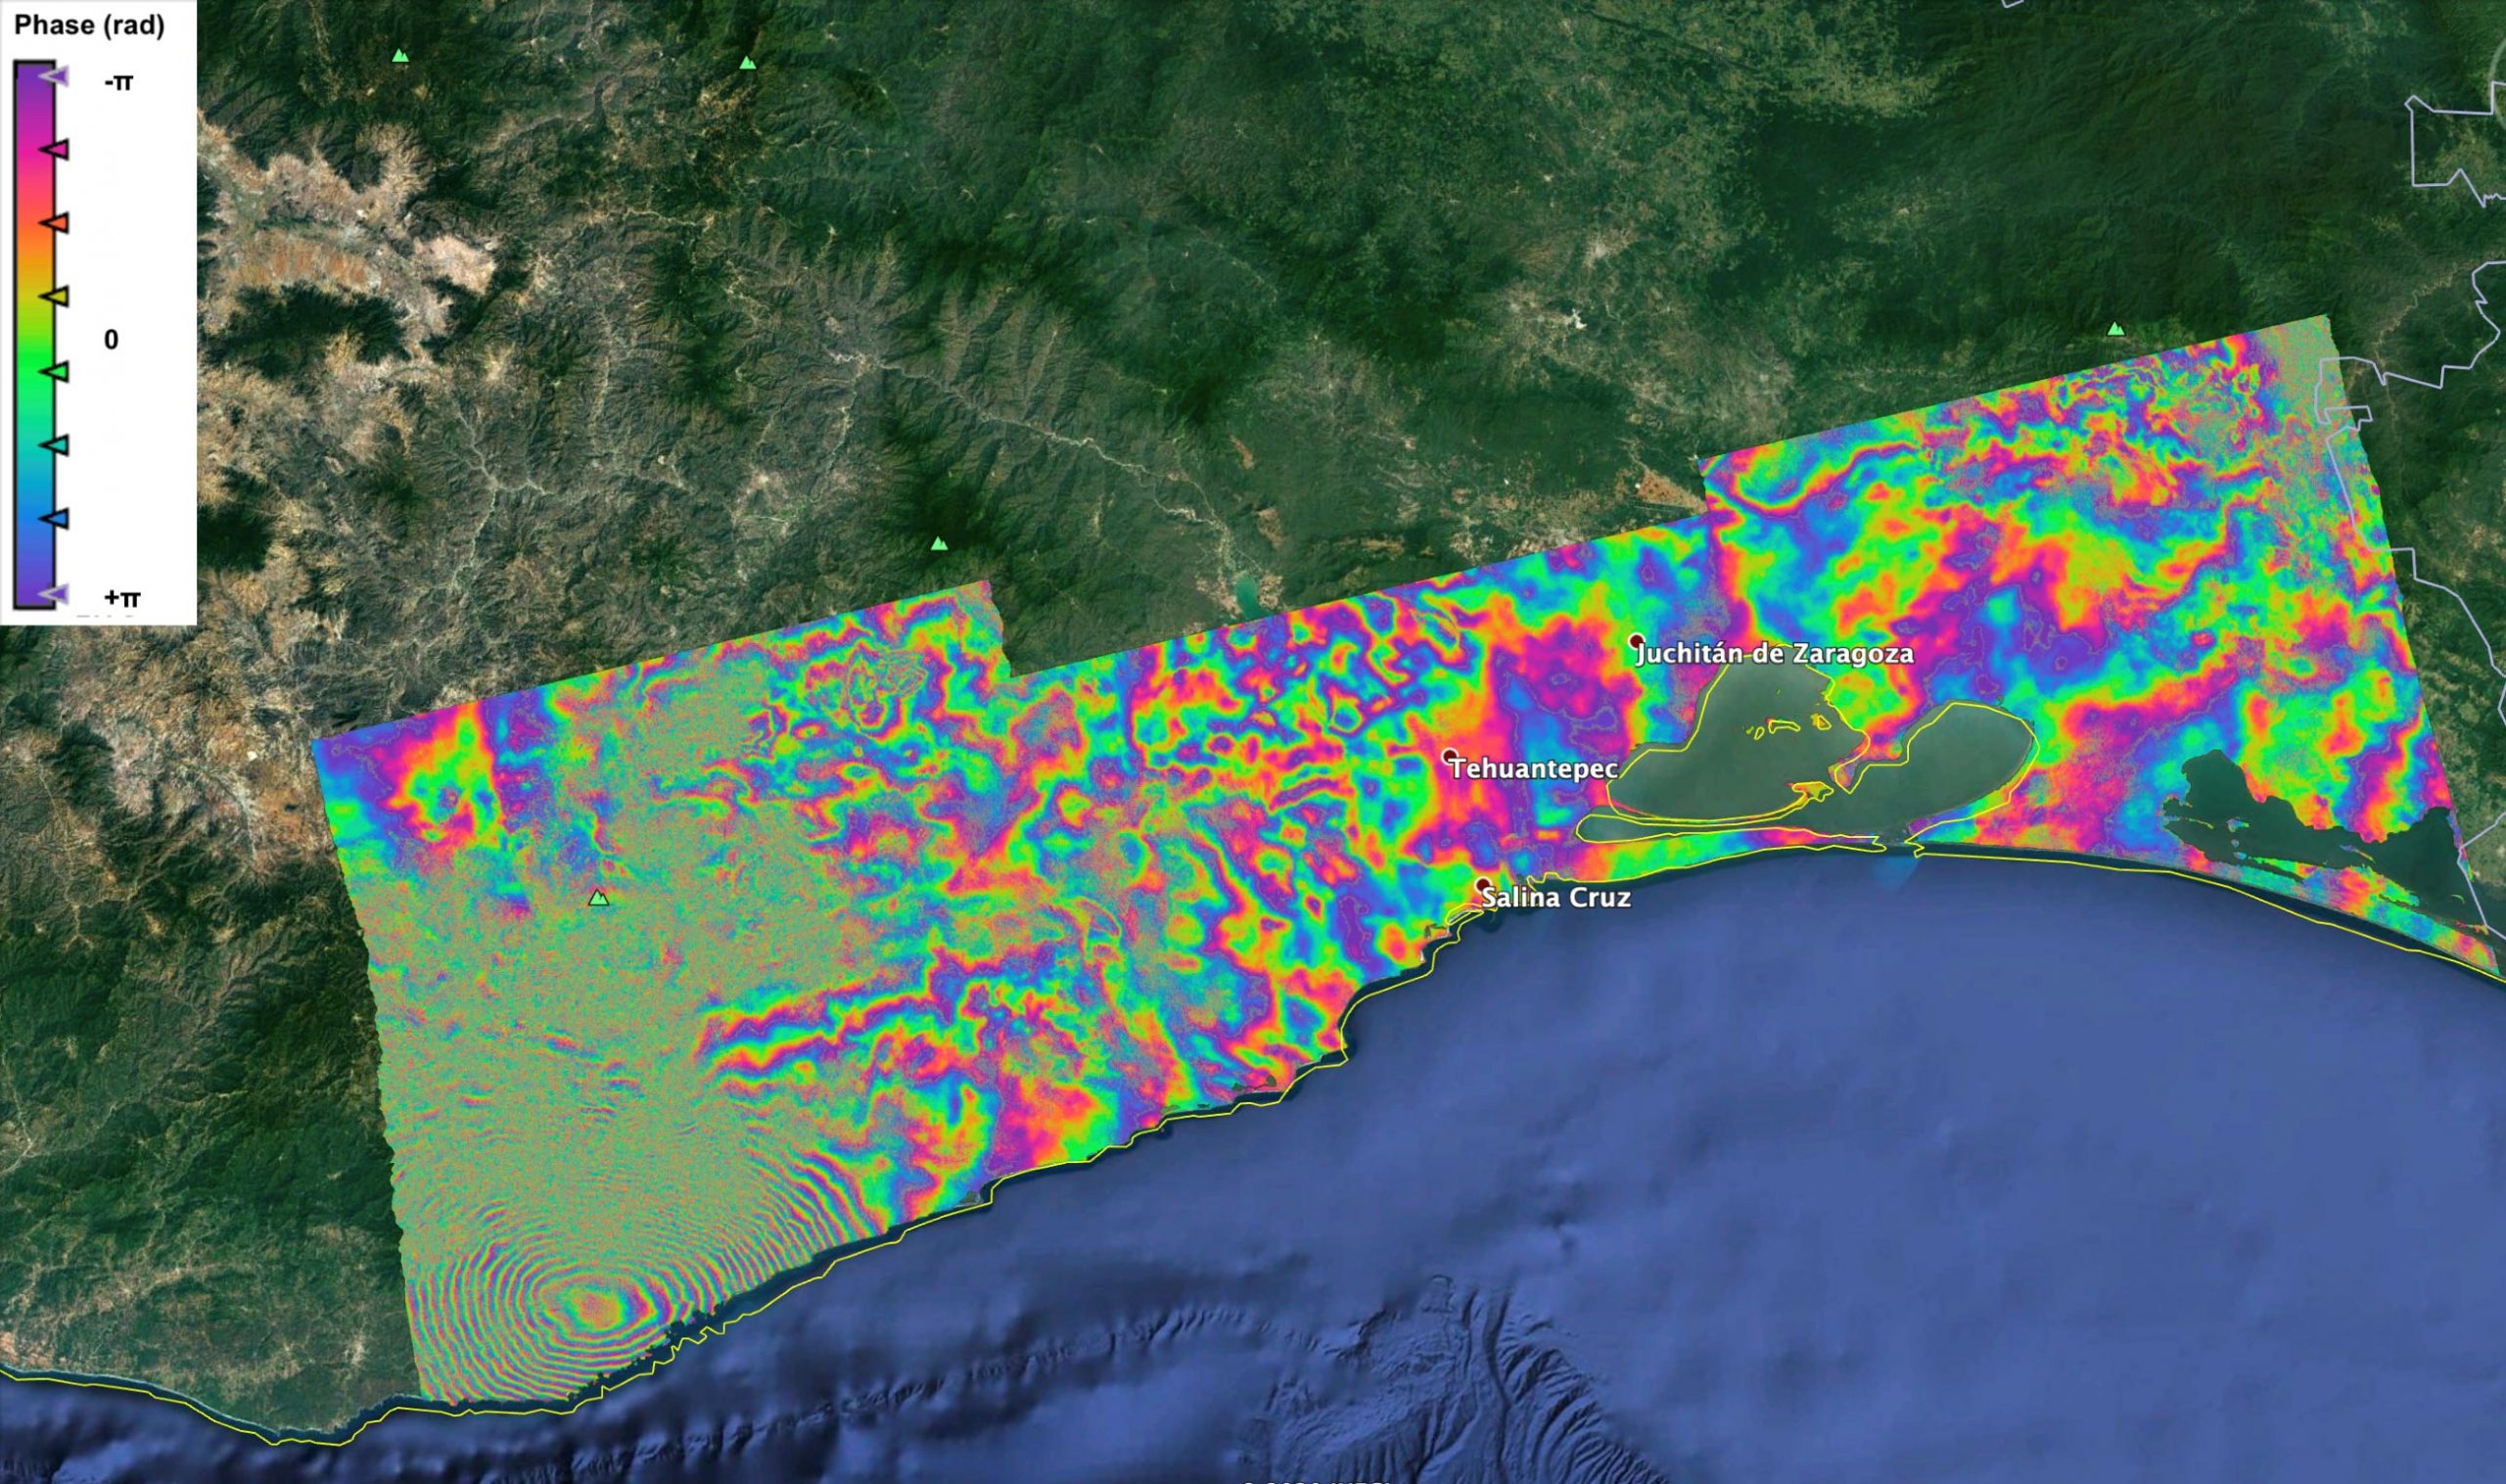
In the figures above, data from the Sentinel-1A and Sentinel-1B satellite, acquired shortly before and after the earthquake, have been combined to measure the coseismic surface displacement, or changes on the ground, that occurred between the two acquisition dates. This leads to the colorful interference (or fringe) pattern known as an ‘interferogram’, which enables scientists to quantify the surface displacement.
Ramón Torres, Copernicus Sentinel-1 Project Manager, explains, “The interferogram represents surface displacement in the radar line of sight, i.e. half of the radar wavelength. The distance between the interference cycle, from yellow to yellow, corresponds to 28 mm deformation in the radar line of sight. For example, a blue-green-red color cycle represents a relative movement towards the radar, while a red-green-blue color cycle means a deformation away from the radar.”
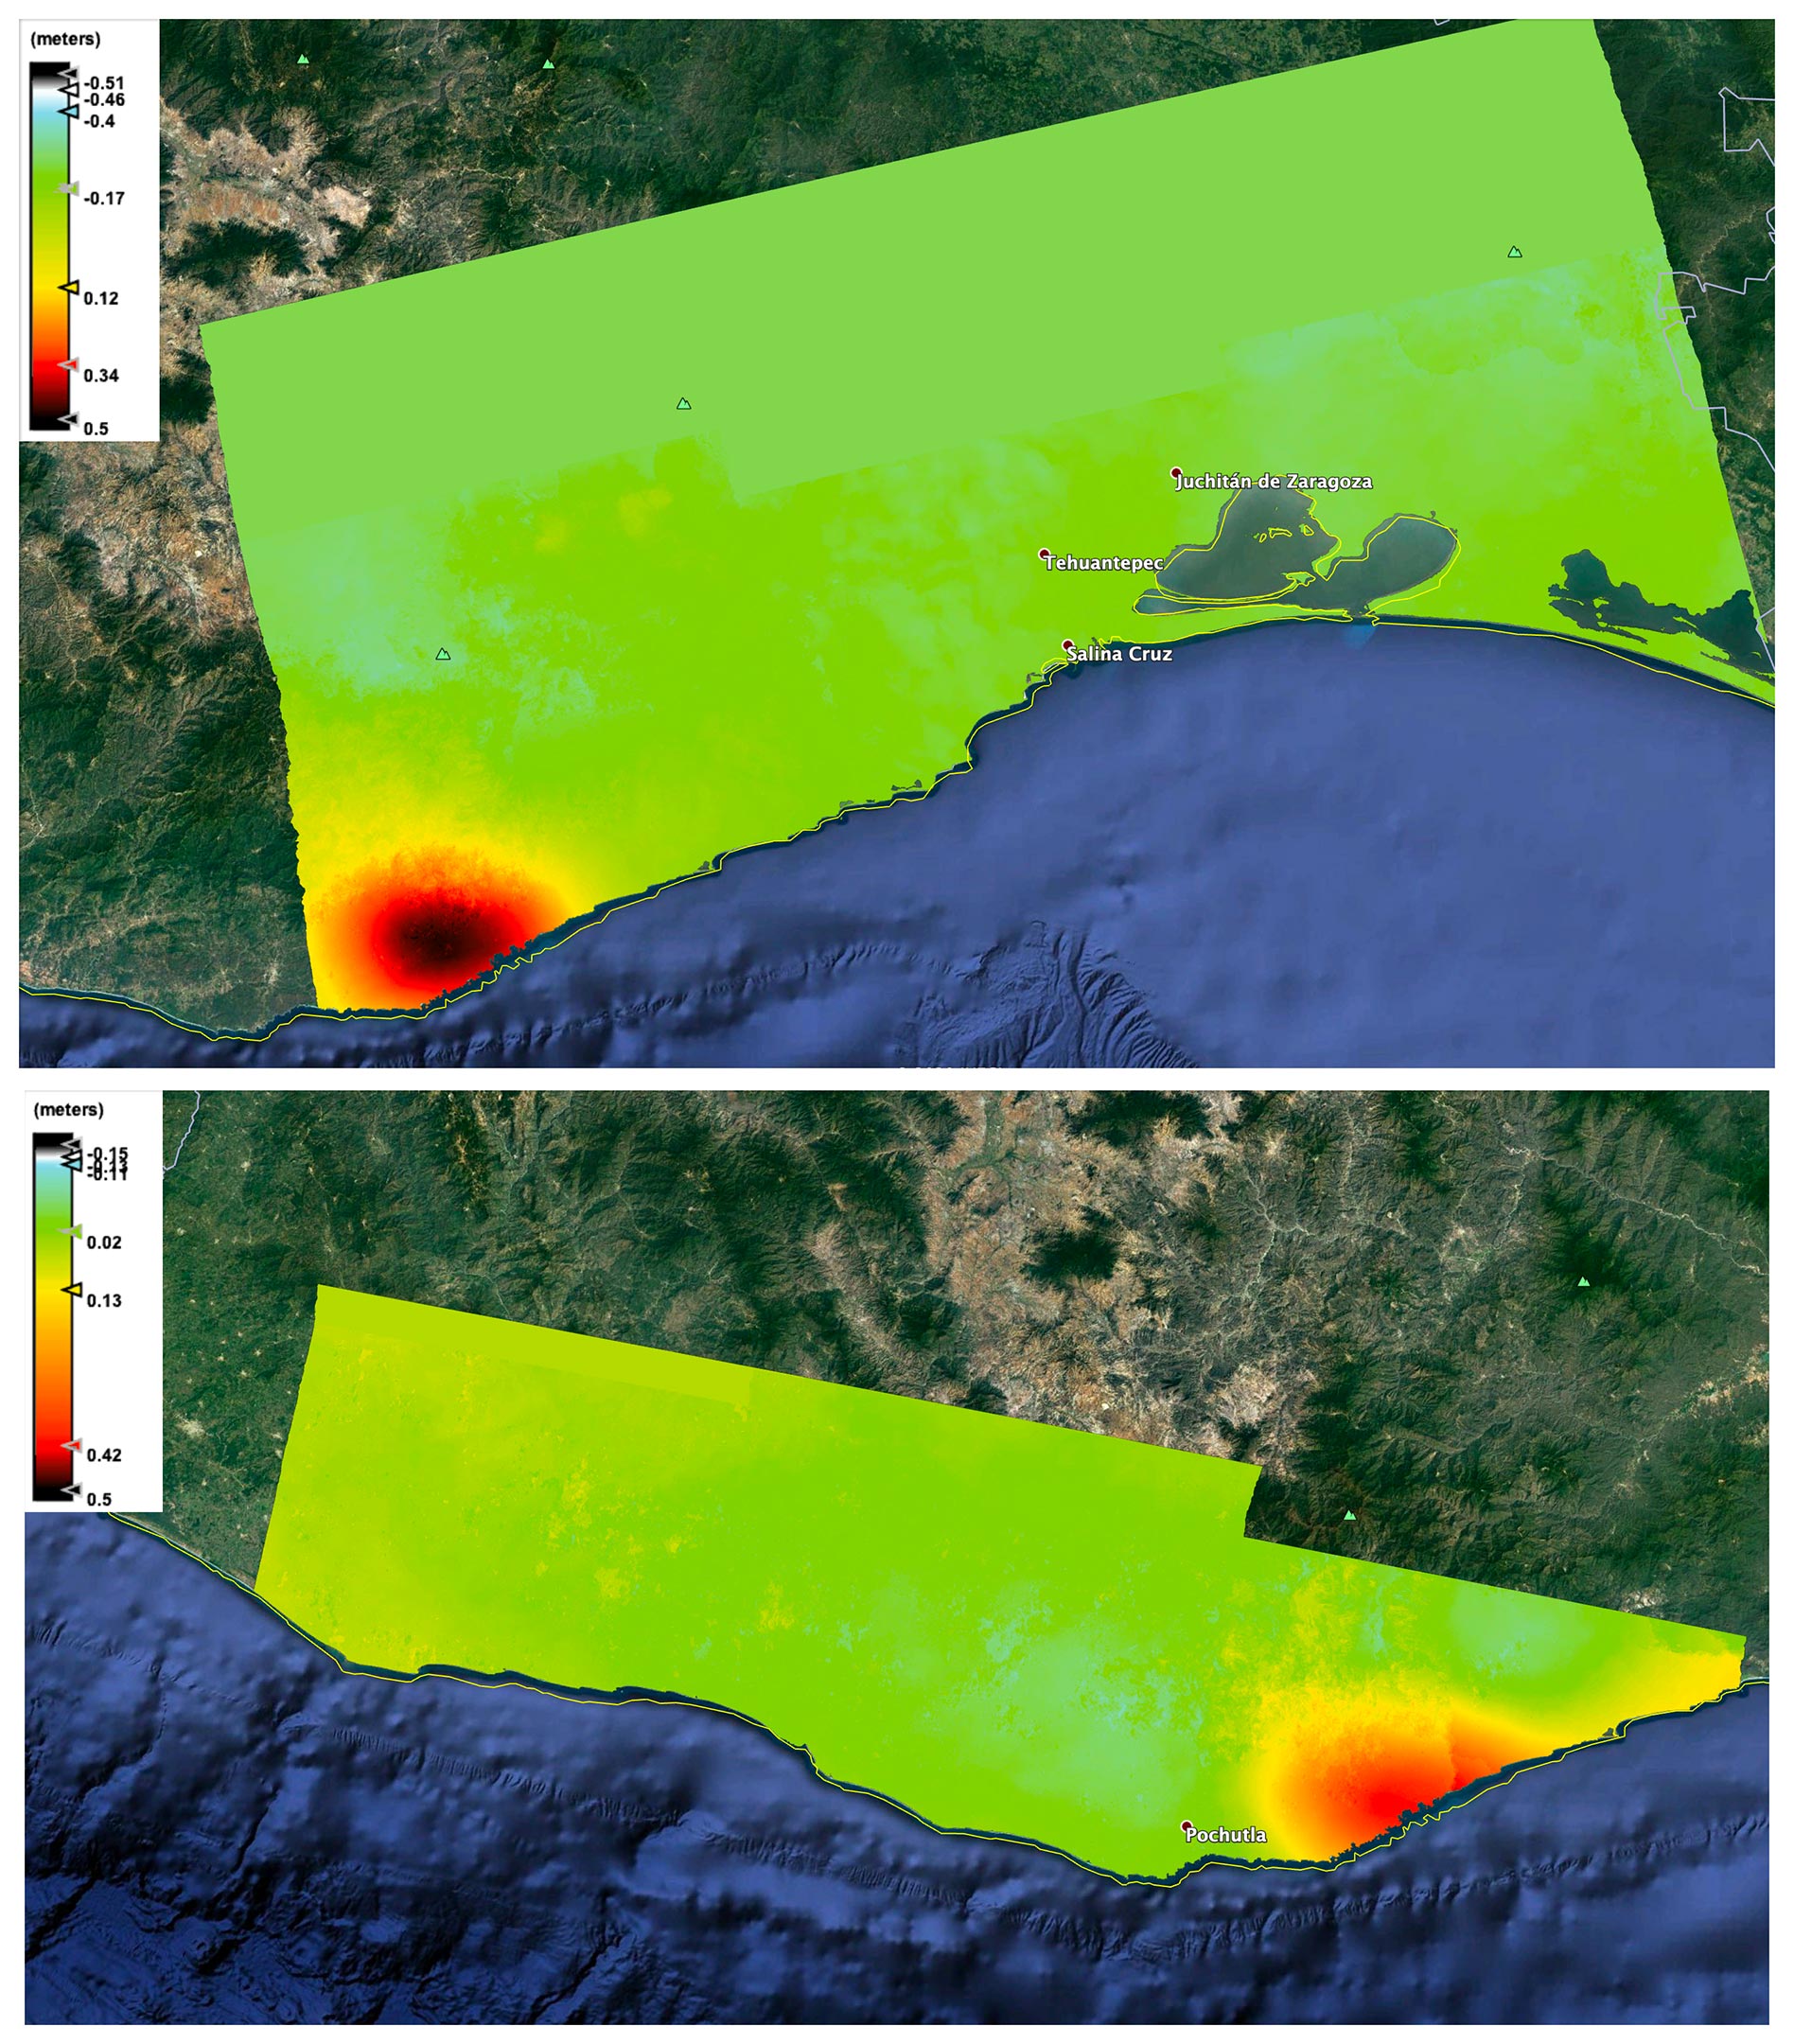
“The fringes can be unwrapped to allow the conversion into meters. The result, referred to as the surface displacement map, shows the relative deformation caused by the earthquake.”
In the Oaxaca images, ground deformation of up to 0.45 m was observed in the coastal city of La Crucecita – where the epicenter was located.
With its 250 km-wide swath over land surfaces, the Copernicus Sentinel-1 mission gives scientists a broad view of the displacement, allowing them to examine the ground displacement and further develop the scientific knowledge of quakes.
By benefitting from the availability of both Sentinel-1A and Sentinel-1B imagery, scientists are able to quantify the ground movement in both vertical and east-west directions by combing the radar scans obtained as the satellites flew both south to north and north to south.
While current radar missions are limited in measuring the east-west component of surface displacement, the proposed Earth Explorer candidate mission, Harmony, will augment the capabilities by adding additional ‘lines of sight’ to the Sentinel-1 mission.
In areas where the displacement is predominantly in the north-south direction, Harmony will have the ability to systematically and accurately measure an additional dimension of displacement. This will help resolve ambiguities in the underlying geophysical processes that lead to earthquakes, landslides, and volcanism.
Looking to the future, the upcoming six high-priority candidate missions (CHIME: Copernicus Hyperspectral Imaging Mission, CIMR: Copernicus Imaging Microwave Radiometer, CO2M: Copernicus Anthropogenic Carbon Dioxide Monitoring, CRISTAL: Copernicus Polar Ice and Snow Topography Altimeter, LSTM: Copernicus Land Surface Temperature Monitoring, and LSTM: Copernicus Land Surface Temperature Monitoring) will expand the current capabilities of the Sentinel missions, one of them being the L-band Synthetic Aperture Radar, ROSE-L, mission, which will also augment the current capabilities of Sentinel-1. The mission will allow scientists to further improve the mapping of earthquakes over the next decade.
Ramón Torres says, “The Sentinel-1 services are very well guaranteed for decades to come. The upcoming Sentinel-1C and Sentinel-1D are in the process of being completed, and the design of the next generation of satellites will begin later this year.”
Never miss a breakthrough: Join the SciTechDaily newsletter.
Follow us on Google and Google News.