
Nearly 50 years of NASA satellite data reveal a troubling decline in Arctic sea ice, raising the possibility of a nearly ice-free summer before 2050.
Satellite observations reveal that Arctic sea ice is covering less of the ocean than it did just a few decades ago, both during the height of winter and at the end of summer. The long-term changes show that the Arctic’s frozen cover is not only shrinking but also becoming younger and thinner.
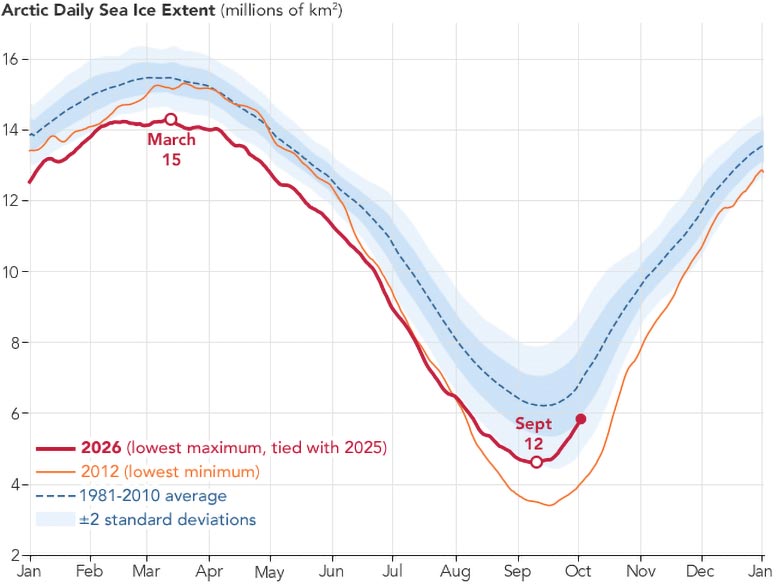
Each year, a vast layer of frozen seawater expands across the Arctic Ocean as temperatures fall during the polar winter. Ice coverage typically reaches its greatest extent in March before gradually retreating through the warmer months to its lowest point in September. This seasonal cycle has repeated for thousands of years, but satellite measurements show that the amount of ice remaining at both extremes has declined substantially.
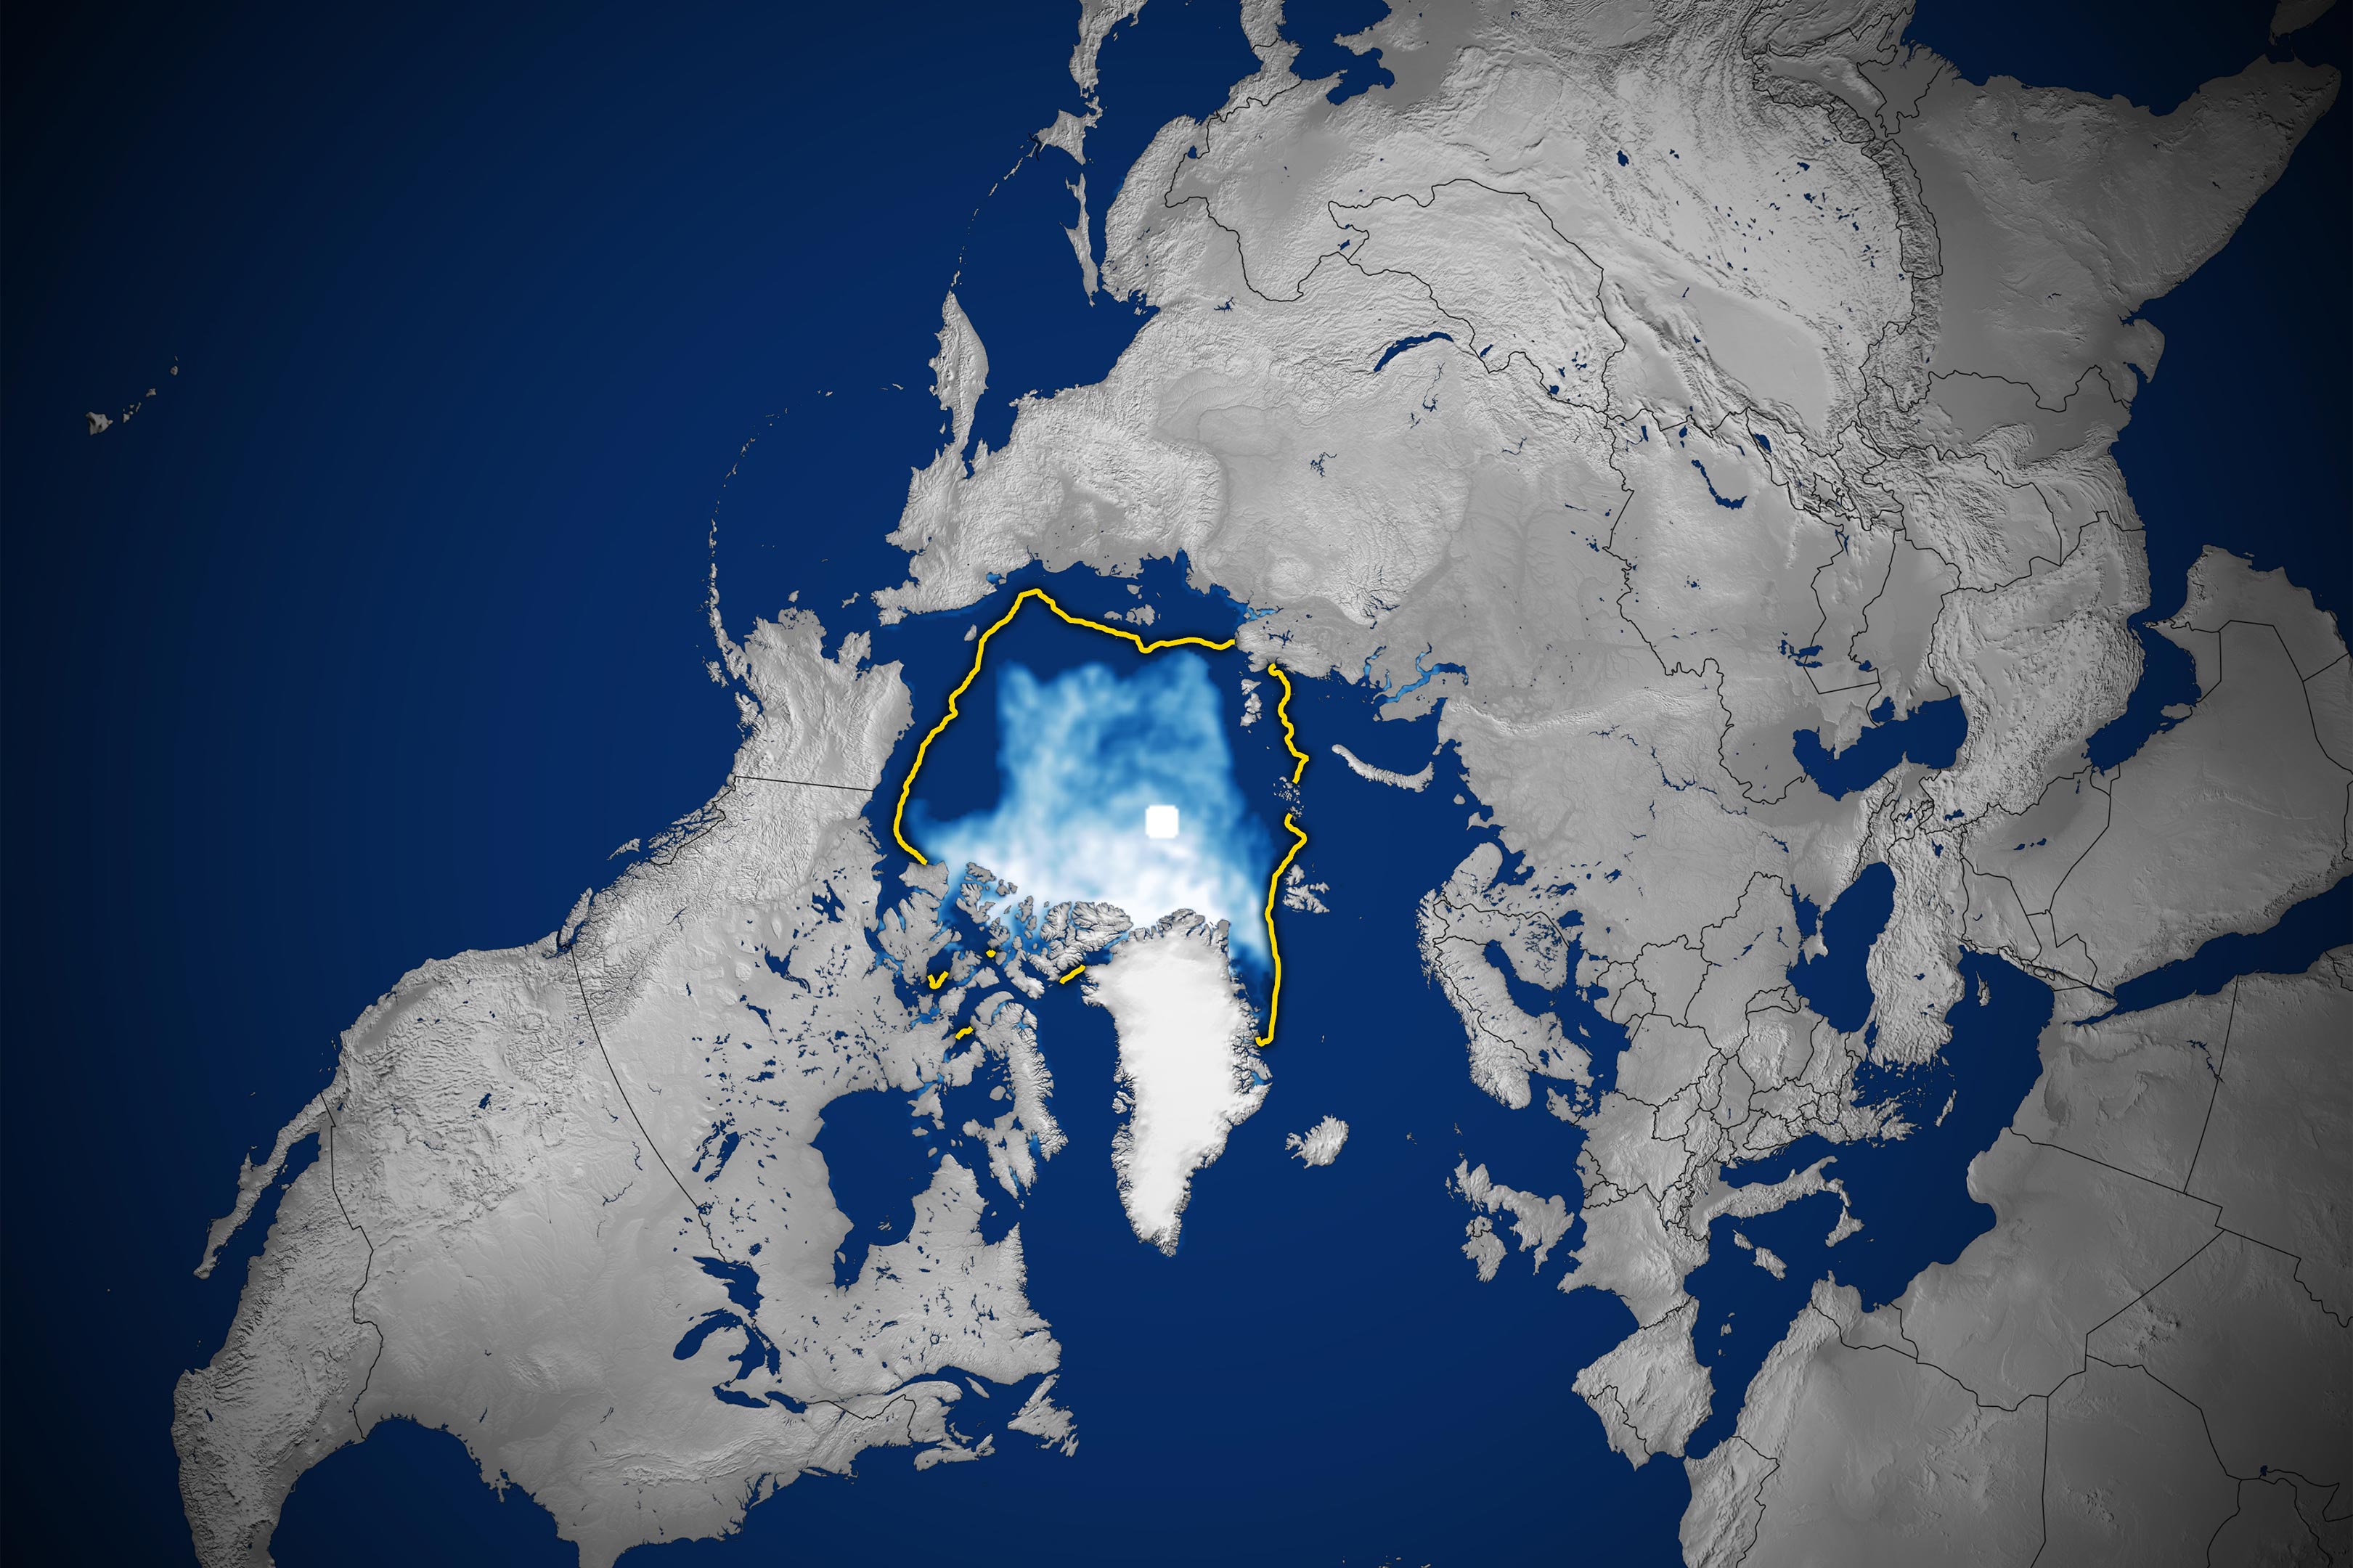
On September 12, 2026, Arctic sea ice reached its annual minimum (above), covering approximately 4.6 million square kilometers (1.78 million square miles). According to NASA and the National Snow and Ice Data Center (NSIDC), that figure ties the minimums recorded in 2008, 2010, and 2025 as the 10th lowest since satellite monitoring began.
Arctic Sea Ice Is Shrinking and Getting Thinner
Satellites have provided an uninterrupted record of Arctic sea ice growth and retreat since late 1978, allowing researchers to track changes across nearly five decades. Although the overall trend has been downward, the decline accelerated during the 2000s, bringing a succession of record and near-record lows.
One particularly striking pattern has emerged. Every summer from 2007 through 2026 falls among the 20 lowest September ice extents ever measured by satellites. The smallest summer ice cover in the entire record occurred in September 2012.
However, the decline in September ice coverage has slowed in recent years, with minimum extents remaining relatively stable over the past decade. Scientists explain that changing weather conditions can strongly influence how much ice disappears during any particular summer.
Increased cloud cover, for example, has reduced the amount of sunlight reaching Arctic ice during the past decade, helping limit additional melting. According to NASA researchers, this has contributed to the recent leveling off in summer ice losses. Even so, September ice coverage remains far below its historical average.
The amount of ice is only part of the story. The Arctic’s remaining sea ice has also become increasingly thin and young.
Scientists have documented a substantial reduction in multiyear ice, which is ice that survives at least one summer melting season. This older ice tends to be thicker and more resilient than ice that forms during a single winter. As it disappears, the Arctic is becoming increasingly dominated by thinner first-year ice, making its frozen cover more vulnerable to melting.
The changes are not limited to summer. Arctic sea ice is also failing to recover to its former extent during the winter months. In March 2026, the annual maximum ice coverage statistically tied the March 2025 maximum for the lowest winter peak in the satellite record.
Could the Arctic Become Nearly Ice-Free?
Natural climate patterns have always affected how much ice covers the Arctic Ocean. One example is the Arctic Oscillation, a pattern of atmospheric pressure changes that influences winds and temperatures across the northern polar region.
These natural fluctuations can help explain why ice coverage varies from year to year. However, they cannot account for the persistent decline observed throughout the satellite record.
Instead, scientists attribute the long-term losses to a combination of natural variability and increasing global temperatures, which have contributed to greater melting across the Arctic.
Looking ahead, climate projections suggest an even more dramatic change may be possible. Scientists estimate that the Arctic Ocean could become essentially free of sea ice during at least one summer before the middle of the 21st century.
How Satellites Track Arctic Sea Ice Through Clouds
Monitoring sea ice across the enormous and often cloud-covered Arctic Ocean requires specialized satellite instruments. Scientists use passive microwave sensors, which detect microwave energy naturally emitted from Earth’s surface.
Frozen seawater and open ocean release different amounts of microwave energy, with sea ice producing a stronger signal. By analyzing these differences, researchers can distinguish ice-covered areas from open water and calculate the total area of ocean covered by sea ice.
A major advantage of this approach is that microwaves can pass through clouds. That allows scientists to monitor Arctic ice consistently, even when clouds obscure the surface from ordinary cameras.
The satellite record began in 1978 with measurements from NASA’s Nimbus-7. Beginning in 1987, satellites from the Defense Meteorological Satellite Program (DMSP) contributed additional observations. NASA’s Aqua satellite also supplied data between 2002 and 2011.
In 2025, researchers began incorporating measurements from the Japan Aerospace Exploration Agency’s GCOM-W satellite, continuing the decades-long monitoring effort.
The white circle visible at the center of each satellite image represents the “pole hole,” an area near the North Pole where satellite instruments have historically been unable to gather measurements. When calculating Arctic sea ice extent, scientists assume that this unobserved region is completely covered by ice.
Together, these satellite observations provide an increasingly detailed picture of how the Arctic’s frozen ocean is changing, revealing a long-term decline that continues despite temporary variations in the pace of summer melting.
NASA Earth Observatory images by Michala Garrison, using data from the National Snow and Ice Data Center.
Never miss a breakthrough: Join the SciTechDaily newsletter.
Follow us on Google and Google News.
5 Comments
Back in the 1950s, a science fiction writer pointed out evidence for the old saying that WHAT one says is less important than HOW they say it. The point made was that if one were offered a dinner with a main course of a bloody segment of muscle tissue from a castrated bull, or a rare, grilled steak smothered in mushrooms, they would almost certainly opt for the steak. However, they are the same.
In a similar manner, how the news about what is happening in the Arctic is presented is generally of greater concern than what is happening. They mention that “The smallest summer ice cover in the entire record occurred in September 2012.” What they don’t mention is that every year since then (14 years) has had greater coverage during the annual low. Looking at a graph of the annual lows in ice coverage over time, it appears that we are experiencing a new regime. That is, the former downward trend appears to have at least temporally halted.
They claim “However, the decline in September ice coverage has slowed in recent years, with minimum extents remaining relatively stable over the past decade.” Actually, it looks to me that for nearly half the period that is usually used to define ‘climate,’ there has been no trend. They missed an opportunity to support their claim by calculating the 2013-2026 trend and stating whether it was statistically significant or not. I suspect that it was more than an oversight.
“Looking ahead, climate projections suggest an even more dramatic change may be possible.”
I am more interested in the probability than the possibility. The extant global circulation models are known to run warm. The unstated assumption is that the various models regress around true mean. The fact that it is acknowledged by modelers that the models run warm strongly suggests that the assumption is false and the ensemble is biased.
Arctic sea ice Volume is what you need to look at. There has been no pause in its downward trend. You can find a graph of sea ice volume since 1980 at – PIOMAS Arctic Sea Ice Volume Reanalysis – University of Washington Polar Science Center.
And that graph shows two shaded areas of 1 and 2 sigma standard deviations. The only big breakouts from both of those were to the low side of the downward trend.
Sea ice extent can refer to tightly packed floating ice or only very thinly packed sea ice, depending on winds and currents. The record low in 2007 was largely because of storms pushing sea ice down through Fram Strait into The Greenland Sea and Norwegian Sea, and the North Atlantic
“There has been no pause in its downward trend.”
That claim is false. It appears from the link that you recommended that the volume is behaving similarly to the area. The Arctic sea ice reached a minimum in 2012 and the coverage has been increasing since then. The problem is, the reanalysis is truncated earlier than the areal measurements. Therefore, we can’t make a direct comparison. But even the truncated reanalysis strongly suggests that we have entered a new regime.
Just because a linear trend can be fitted to a time series, it doesn’t demonstrate that it is the best explanation of what is happening.
The Global Climate 2011-2020: Sea Ice
“There has also been a marked decrease in the extent of ice which lasted for more than one year.
In March 1985, old ice (four years or more) accounted for 33% of the total ice cover of the Arctic Ocean, but that figure had fallen below 10% by 2010, and in March 2020 it had dropped to 4.4%. Ice of this age is now mostly confined to a narrow strip extending from north of Greenland along the north-west edge of the Canadian archipelago.”
World Meteorology Organization WMO
You would obviously choose the grilled steak simply because it would be the most palatable to your tastes.