Arctic and Antarctic regions faced significant ice losses in 2024, with Arctic sea ice reaching its seventh-lowest extent on record. The persistent reduction in polar ice contributes to broader ecological changes and heightened warming, driven by the ice-albedo feedback mechanism.
Arctic sea ice retreated to near-historic lows in the Northern Hemisphere this summer, melting to its likely minimum extent for the year on September 11, 2024. This observation comes from NASA and the National Snow and Ice Data Center (NSIDC), highlighting a continuing trend of diminishing ice cover in the Arctic Ocean that has persisted for decades.
Throughout the year, the Arctic sea ice naturally expands and contracts in response to seasonal variations. Researchers monitor these changes to understand the Arctic’s long-term reactions to increasing air and sea temperatures and prolonged melting seasons. Data collected over the past 46 years from satellites show a consistent pattern: more extensive melting during the summer months and reduced ice formation during the winter.
Impacts of Diminishing Arctic Ice
Tracking sea ice changes in real-time has revealed wide-ranging impacts, from losses and changes in polar wildlife habitat to impacts on local communities in the Arctic and international trade routes.
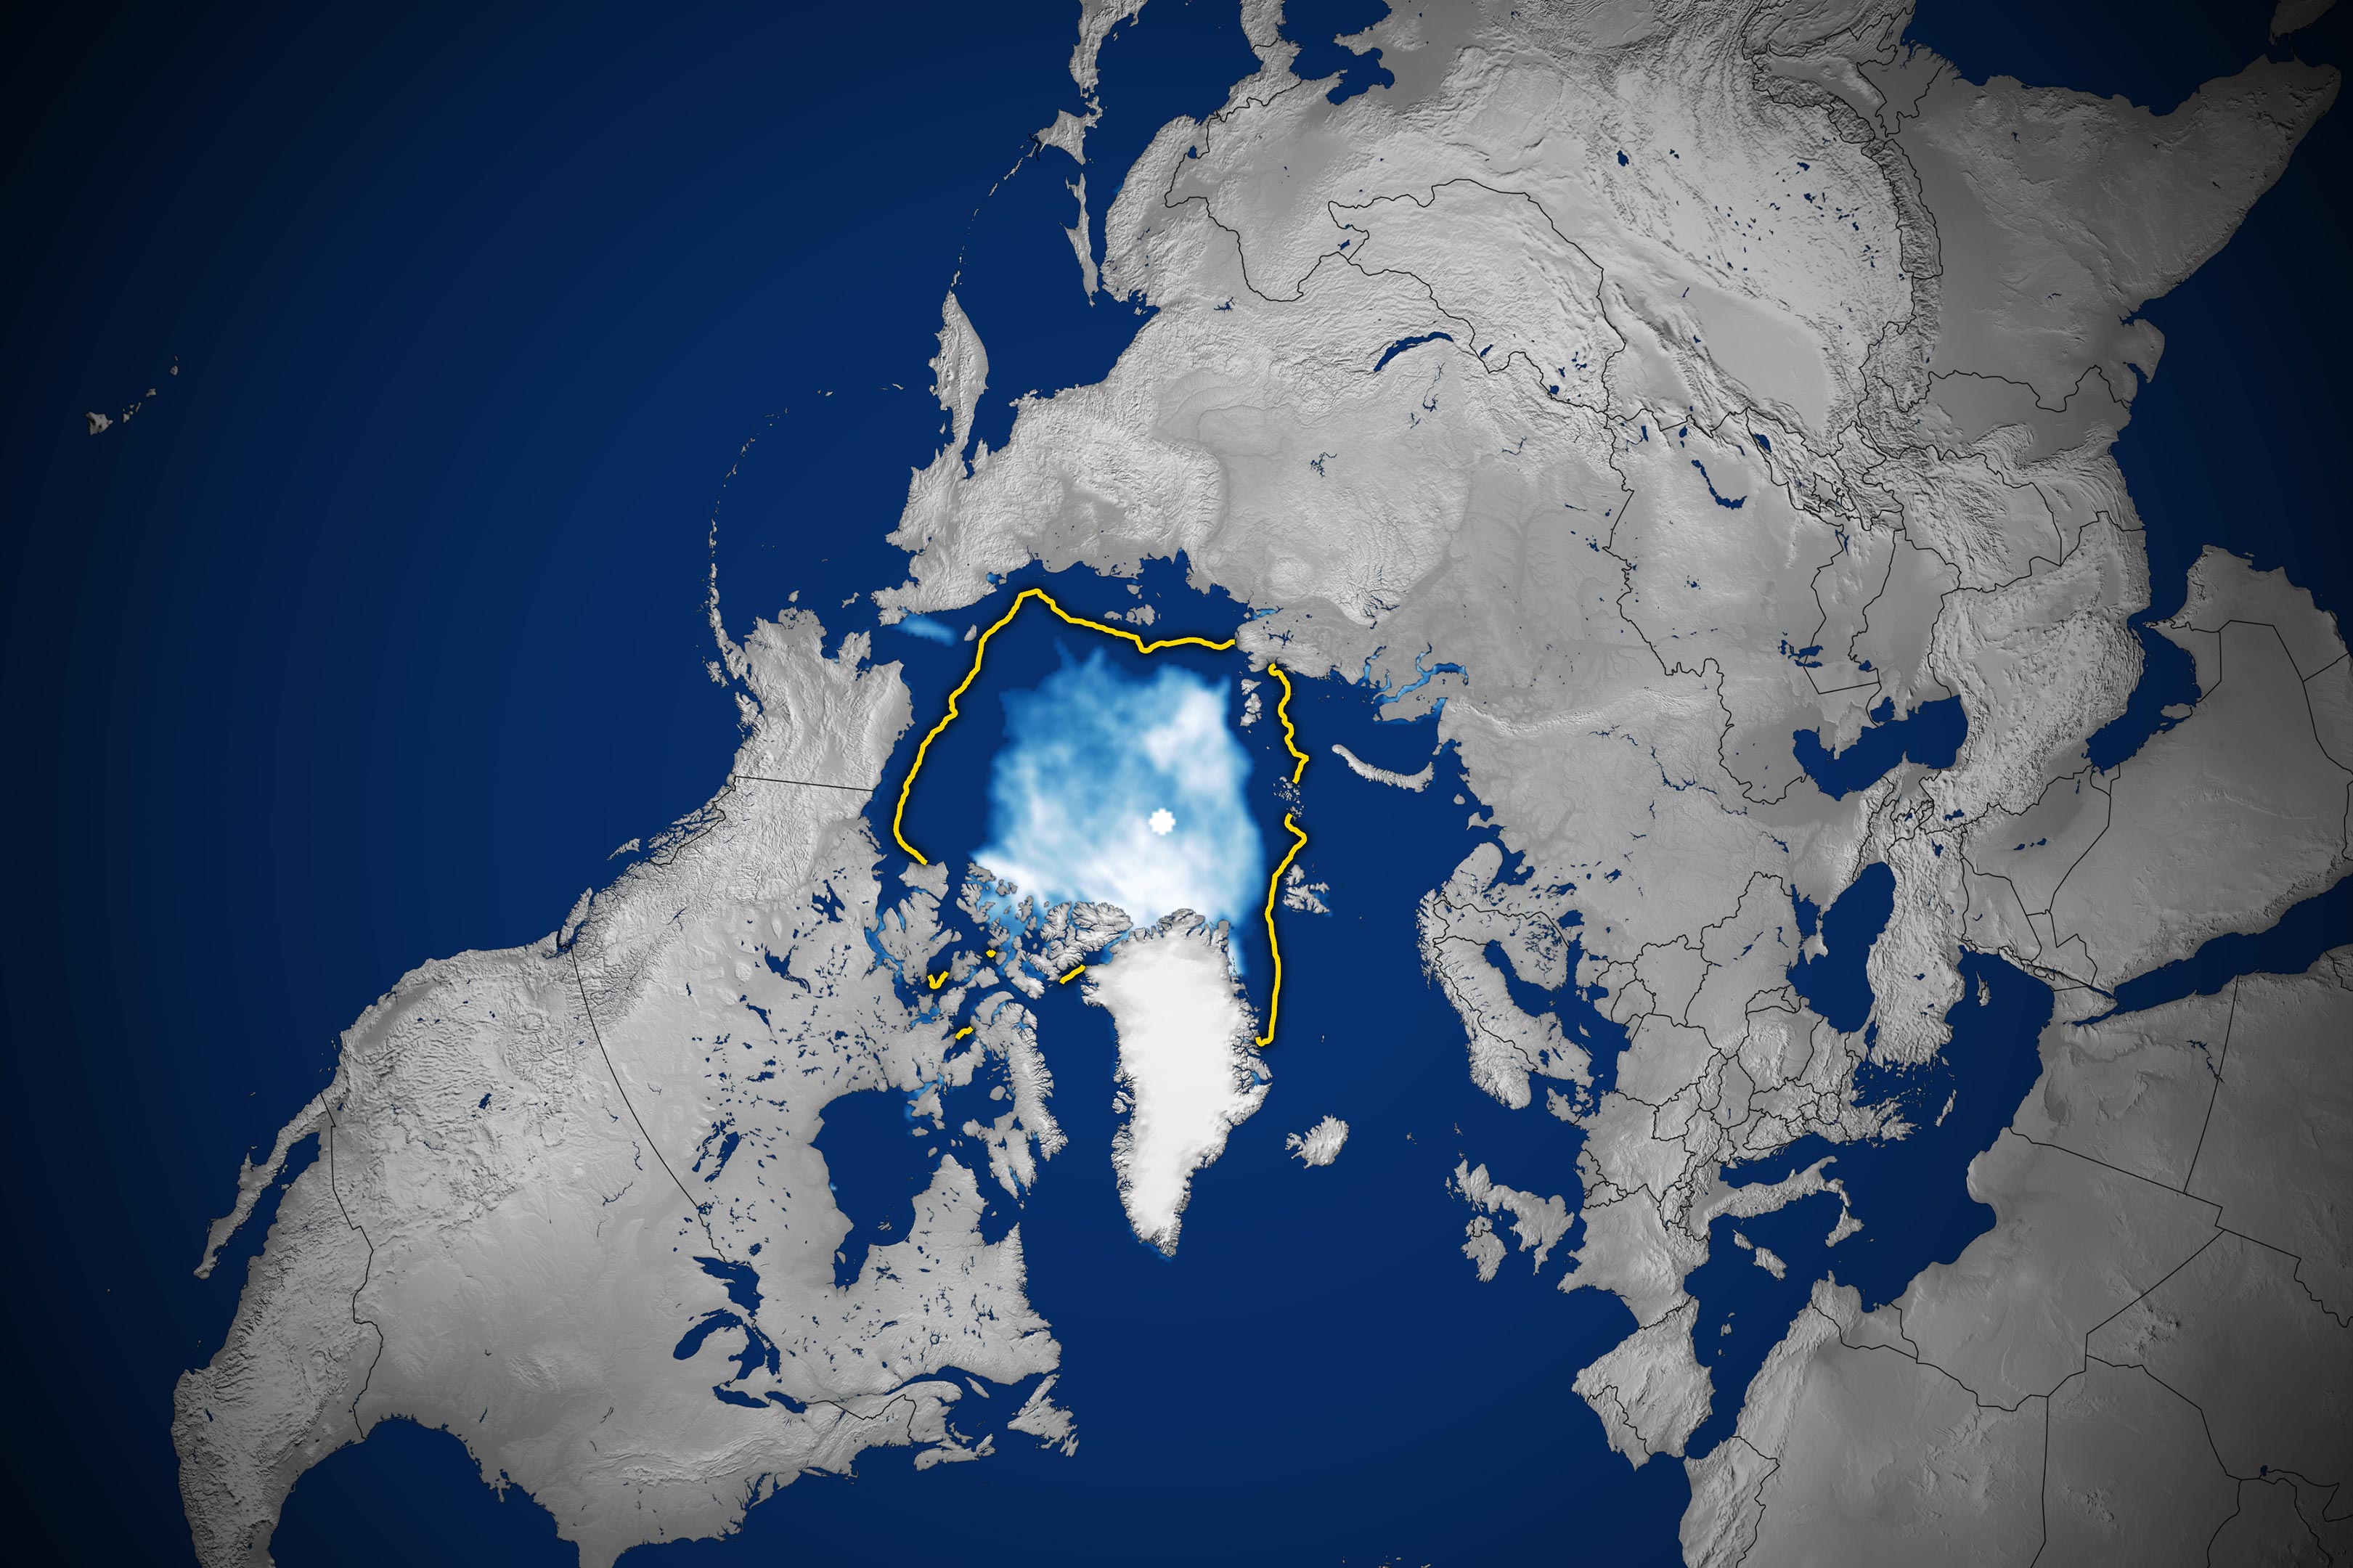
This year, Arctic sea ice shrank to a minimum extent of 4.28 million square kilometers (1.65 million square miles), as shown on the map above. That’s about 1.94 million square kilometers (750,000 square miles) below the 1981 to 2010 end-of-summer average of 6.22 million square kilometers (2.4 million square miles). The difference in ice cover spans an area larger than the state of Alaska. Sea ice extent is defined as the total area of the ocean with at least 15 percent ice concentration.

Trends and Measurements of Sea Ice
This year’s minimum—the seventh lowest in the satellite record—remained above the all-time low of 3.39 million square kilometers (1.31 million square miles) set in September 2012. While sea ice coverage can fluctuate from year to year, it has trended downward since the start of the satellite record for ice in the late 1970s. Since then, the loss of sea ice has been about 77,800 square kilometers (30,000 square miles) per year, according to NSIDC.
Scientists currently measure sea ice extent using data from passive microwave sensors aboard satellites in the Defense Meteorological Satellite Program, with additional historical data from the Nimbus-7 satellite, jointly operated by NASA and the National Oceanic and Atmospheric Administration (NOAA).
Sea ice is not only shrinking, it’s also getting younger, noted Nathan Kurtz, chief of the Cryospheric Sciences Laboratory at NASA’s Goddard Space Flight Center. “Today, the overwhelming majority of ice in the Arctic Ocean is thinner, first-year ice, which is less able to survive the warmer months. There is far, far less ice that is three years or older now,” Kurtz said.
Ice thickness measurements collected with spaceborne altimeters, including NASA’s ICESat and ICESat-2 satellites, have found that much of the oldest, thickest ice has already been lost. New research out of NASA’s Jet Propulsion Laboratory shows that in the central Arctic, away from the coasts, fall sea ice now hovers around 1.3 meters (4.2 feet) thick, down from a peak of 2.7 meters (8.8 feet) in 1980.
The State of Ice in the Southern Hemisphere
Sea ice in the southern polar regions of the planet was also low in 2024. Around Antarctica, scientists tracked near-record-low sea ice at a time when it should have been growing extensively during the Southern Hemisphere’s darkest and coldest months.

Ice around the continent likely reached its maximum extent for the year on September 19, 2024, when growth stalled out at 17.16 million square kilometers (6.63 million square miles). This year’s maximum, shown on the map above, was the second lowest in the satellite record and remained above the record winter low of 16.96 million square kilometers (6.55 million square miles) set in September 2023. The average maximum extent between 1981 and 2010 was 18.71 million square kilometers (7.22 million square miles).
The meager growth in 2024 prolongs a recent downward trend. Prior to 2014, sea ice in the Antarctic was increasing slightly by about 1 percent per decade. Following a spike in 2014, ice growth has fallen dramatically. Scientists are working to understand the cause of this reversal. The recurring loss hints at a long-term shift in conditions in the Southern Ocean, likely resulting from global climate change.
“While changes in sea ice have been dramatic in the Arctic over several decades, Antarctic sea ice was relatively stable. But that has changed,” said Walt Meier, a sea ice scientist at NSIDC. “It appears that global warming has come to the Southern Ocean.”

In both the Arctic and Antarctic, ice loss compounds ice loss. This is because while bright sea ice reflects most of the Sun’s energy back to space, open ocean water absorbs 90 percent of it. With more of the ocean exposed to sunlight, water temperatures rise, further delaying sea ice growth. This cycle of reinforced warming is called ice-albedo feedback.
Overall, the loss of sea ice increases heat in the Arctic, where temperatures have risen about four times the global average, Kurtz said.
NASA Earth Observatory images by Lauren Dauphin, using data from the National Snow and Ice Data Center. Story by Sally Younger, NASA’s Earth Science News Team, updated and adapted for Earth Observatory by Kathryn Hansen.
Never miss a breakthrough: Join the SciTechDaily newsletter.
Follow us on Google and Google News.
25 Comments
In other news, blah blah blah, blah fricken blah.
Ice area loss is not nearly as concerning as ice volume loss which is close to 90% compared to 1979.
Global warming is multi-factorial and thus, greenhouse gas evidential theories are only one of the many stressors increasing global temperatures.
With safest policy review of everyone, it is helpful to consider asphalt trends of over development producing urban heat budgets and heat domestically. There are aloss angricultural overdrafts from underground aquifers, when drip water feeders prove to be conserving water resources and producing high quality produce.
Also, before the 1600’s, the beaver populations of North America and Europe, each had over several hundred million beaver populations, which were building step dams in forested watersheds and increasing the water tables with high aquifer recharge rates in most areas! With the depletions of step dams, there have been increasing very low water tables, with high risks of numerous wild fires and super heated regions. More appropriately simulated step dams could help to improve higher water tables, preventing flooding down stream in rivers! With safest policy review.
The Urban heat island effect is factored in to climate models.
Urban areas and non urban areas are warming at the same rate.
We are at solar maximum on the 11 year cycles and in a Grand solar Maximum. So the ice is just fine really.
Those several hundred million beavers were also contributing significantly to wetlands methane production.
Now about those umpteen million-strong buffalo herds that got shot to death in a mere few years?
I’m not sure what your point is other than to bad mouth humans. Bison contributed methane and CO2, but have largely been replaced by cows, pigs, chickens, and sheep.
Don’t blame the beavers and other animals. It’s the HUMANS that have put the earth in the trouble it is in now.
No, the Earth isn’t really in trouble. Humans are in trouble because of what humans have done. We are our own worst enemy.
“This is because while bright sea ice reflects most of the Sun’s energy back to space, open ocean water absorbs 90 percent of it.”
That statement is too general. Mid-Winter, there is no direct sunlight in the polar regions. The polar regions are typically very cloudy; the amount of light reflected or absorbed depends very much on the cloudiness. In the rare absence of clouds, the amount of light absorbed by open ocean depends on the time of day and the month; when the sun is very low on the horizon, morning and afternoon in the local Summer, The specular reflectance off water can exceed the diffuse reflectance off snow. In the Spring and Fall, the sun is always low on the horizon, giving very large angles of incidence. The numbers given above are only approximately valid for normal incidence (0 deg) up to about 65 degrees, which is the latitude of the Arctic/Antarctic circles. I suspect that the quoted numbers are only valid for the tropics and mid-latitudes, where the total reflectance is composed of diffuse reflectance from suspended plankton and sediment, and specular reflectance, which varies with the time of day.
See Figure 1 at the following link:
https://wattsupwiththat.com/2016/09/12/why-albedo-is-the-wrong-measure-of-reflectivity-for-modeling-climate/
I’m disappointed with NASA being so cavalier with the facts and making things appear so simple that they are wrong.
We need to start building reflective structures. No more blacktop roads and parking lots, no more black roofs, etc. We can reflect the light energy back into space on a large scale.
Non Sequitur! The article was about polar ice and water. Did you read it? Last time I checked, there were no asphalt roads and parking lots in either location. Inasmuch as the Arctic is warming at a rate 2-4X the average rate of the Earth, it doesn’t appear that the abundant roads and homes in the mid-latitudes play much role.
With dark roofs, the energy demand to keep homes cool will skyrocket. Right now, glare off roads is primarily a problem after a rain and during sunrise/sunset. White roads will increase the frequency of accidents because glare will be almost all the time. I don’t consider that a good tradeoff. Although, keeping the roads white will be difficult and expensive because of tire rubber rubbing off onto the pavement.
“This year’s minimum—the SEVENTH lowest in the satellite record— ”
Nothing is said about the margin of error, or uncertainty, of the annual measurements. Why not?
It should be noted that by the end of September 2024, the Arctic sea ice was at the +/-2 standard deviations line. That means it was within approximately 95% of all modern measurements.
“It should be noted that by the end of September 2024, the Arctic sea ice was at the +/-2 standard deviations line. That means it was within approximately 95% of all modern measurements.”
Is that for every end of September of all modern measurements? i trust that we are comparing all end of Septembers and not throwing in other days in that 95%.
Take a look at the first graph in the article. The standard deviation is for all Septembers from 1981-2010.
The Earth had no icecaps for the majority of geologic history.
The Earth also had no multi cellular life for the majority of geologic history.
The Earth has had both polar ice caps for the entire time that homo sapiens has been known to exist.
I’d kinda hate to see ’em go.
you can see right through it, not long for this earth.
Hopefully all will melt soon completely plus “Ice-capLand”(Greenland) because we don’t need any of it!
“Mid-Winter, there is no direct sunlight in the polar regions”
So that is why the Arctic and Antarctic sea ice don’t reflect sunlight in winter; who’d a’ thunk it!
““This is because while bright sea ice reflects most of the Sun’s energy back to space, open ocean water absorbs 90 percent of it.”
A general simple statement that basically implies that when the sun shines on the Arctic and Antarctic sea ice, sunlight gets reflected off it, the implication being that when the sun don’t shine, sunlight ain’t gonna get reflected. So why your quibble with what is a “popular science” article?
I wonder what the effect is of u/v light when it comes to reflectance off snow and ice. The worst sunburn I received in Antarctica occurred during a long traverse under a total overcast . And the best weather for breeding snow-blindness on a snowfield/glacier is a low overcast to near whiteout. That u/v light certainly seems to bounce around between snow/ice and cloud.
☑️ The folks there at Colorado, at Boulder, do an excellent job. Thank you folks so much for the daily maps & charts.
☑️ The dangerous melting drop that happened in 2012 has not been repeated as expected.
☑️ Greenland actually grew ice in 2017. It was dramatic.
☑️ The elongated shape of Antarctica’s sea ice has recently shown a more rounded pattern with a overall stronger cold than usual at the South Pole over the last 2 years, I’ve noticed, as I have checked this daily.
☑️ It’s interesting but not hopeless, as we can see that China has cut back on coal pollution in the last several years.
☑️ This has helped a little thus far in allowing a BETTER freeze up in the Bering Strait for the last few winters.
☑️ I’m for being observant, optimistic & appreciating all the people who work on these records daily. 🍨🍧🍦
Good for you. Enjoy ice cream –for those who can still smile.
☑️ 🛑 If only HAARP would be stopped, our sick, over-heated atmosphere would have a better chance to regulate its own normal temperatures. (US gov. ?)
“So why your quibble with what is a “popular science” article?”
Because I suspect that the 90% absorption number is a serious over-estimate, biasing readers in their comprehension of the claimed problem. If a number can’t be defended, then I think that the author should stick to lawyer words like “a lot” or “much more.” Even though this website may be aimed at laymen, that does not excuse misinformation or misleading claims.
The reason that the sky appears blue is that shorter wavelengths of sunlight are scattered much more strongly than long wavelengths (That is also why the sun looks yellow instead of green; blue light is extracted by scattering.). As the angle of incidence increases, the spectral distribution begins to look more and more like the source, to at an angle of 90 degrees (100% for almost everything, but especially water) it is identical to the source, which in your situation is extremely rich in UV because it is scattered. In the meantime, the iris of the eye responds to visible wavelengths, opening up when the light is dim. So, your experience in Antarctica was a combination of feeling safe because the perceived light level was low, but the actual radiation was rich in UV. Snow has a hemispherical Bi-Reflectance Distribution Function (BRDF) that has a strong forward lobe because the ice crystals tend to have a sub-parallel alignment (horizontal preference). That means, walking facing into the sun is going to expose one to more UV than walking away or even at right angles. Although, with very clean air, UV coming from all directions isn’t absorbed as much as places where suspended particles are abundant.
I’ll just throw this in..
Ocean Stratification and Heating Oct. 2024 Bob Matheson
Perhaps a major oversight? Researchers have now discovered that 78% of the nano-plastics in the ocean are due to automobile (car) tires. So certainly for a century we’ve been loading the oceans with black tire goo! CO2 only reflects heat, but don’t we have to quantify all the significant heat sources? Around the world the ocean temperature stratification has been increasing. What better source of this effect than oceans full of black tire goo? Surely this is a massive new heat source that is not considered in climate models?
And as one tauted solution to warming, Electric Cars, cars that are twice as heavy and three times as powerful. So if tires are discovered to be the largest source of warming, our solution is Electric Tire Grinders, Thanks Elon?
Perhaps white tires?
I have heard some ocean life forms are now digesting nano-plastics, will that be helpful?
“Arctic and Antarctic regions faced significant ice losses in 2024, with Arctic sea ice reaching its seventh-lowest extent on record.”
Funny how much difference a year can make:
https://scitechdaily.com/antarcticas-astonishing-rebound-ice-sheet-grows-for-the-first-time-in-decades/