Recent findings indicate that the Arctic’s traditional role as a planetary cooling agent is faltering, with hotspots and wildfires nearly nullifying its carbon storage capabilities.
A detailed study spanning three decades reveals a shift towards a more carbon-emitting Arctic, due to longer growing seasons and increased microbial activity, especially during winters. The study maps these changes with unprecedented detail, offering a stark warning and a call to closely monitor these regions.
Disturbing Trends in Northern Carbon Emissions
For thousands of years, the Arctic’s permafrost has acted as a vast carbon storage system, helping to regulate the planet’s climate. However, a new study published today (January 21) in Nature Climate Change reveals that rising temperatures and more frequent wildfires in the northern latitudes are significantly reducing this critical storage capacity.
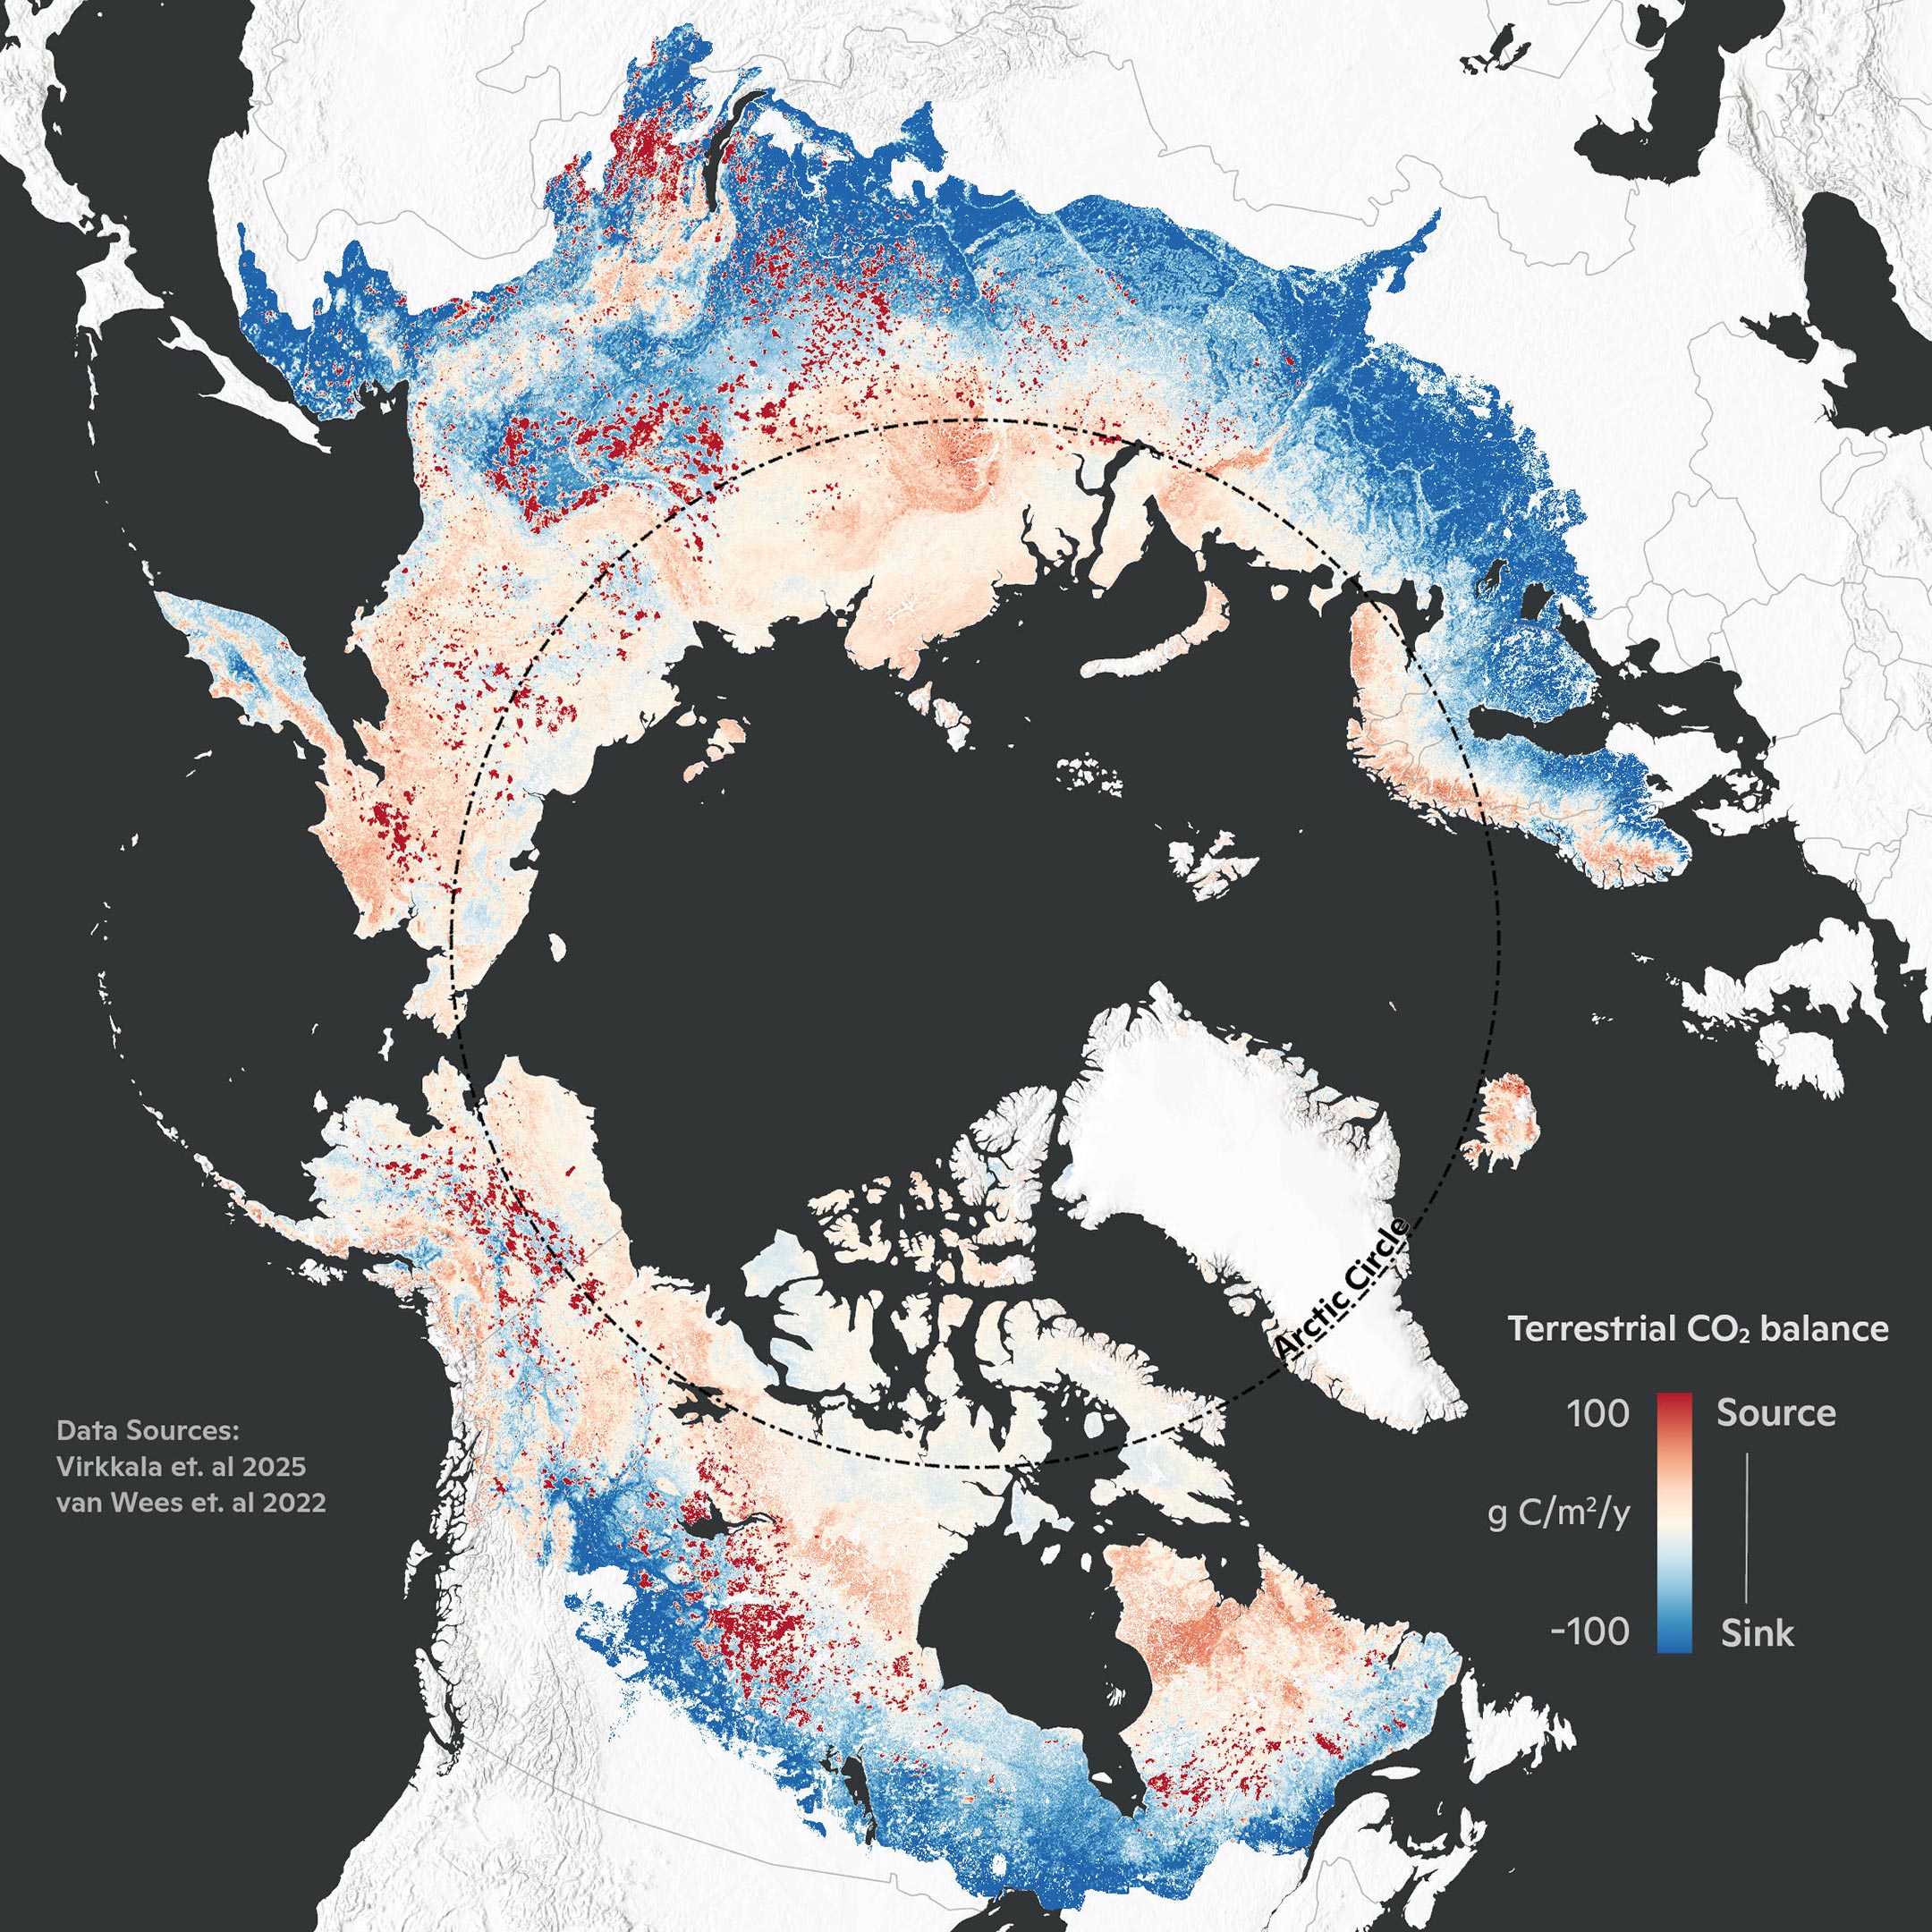
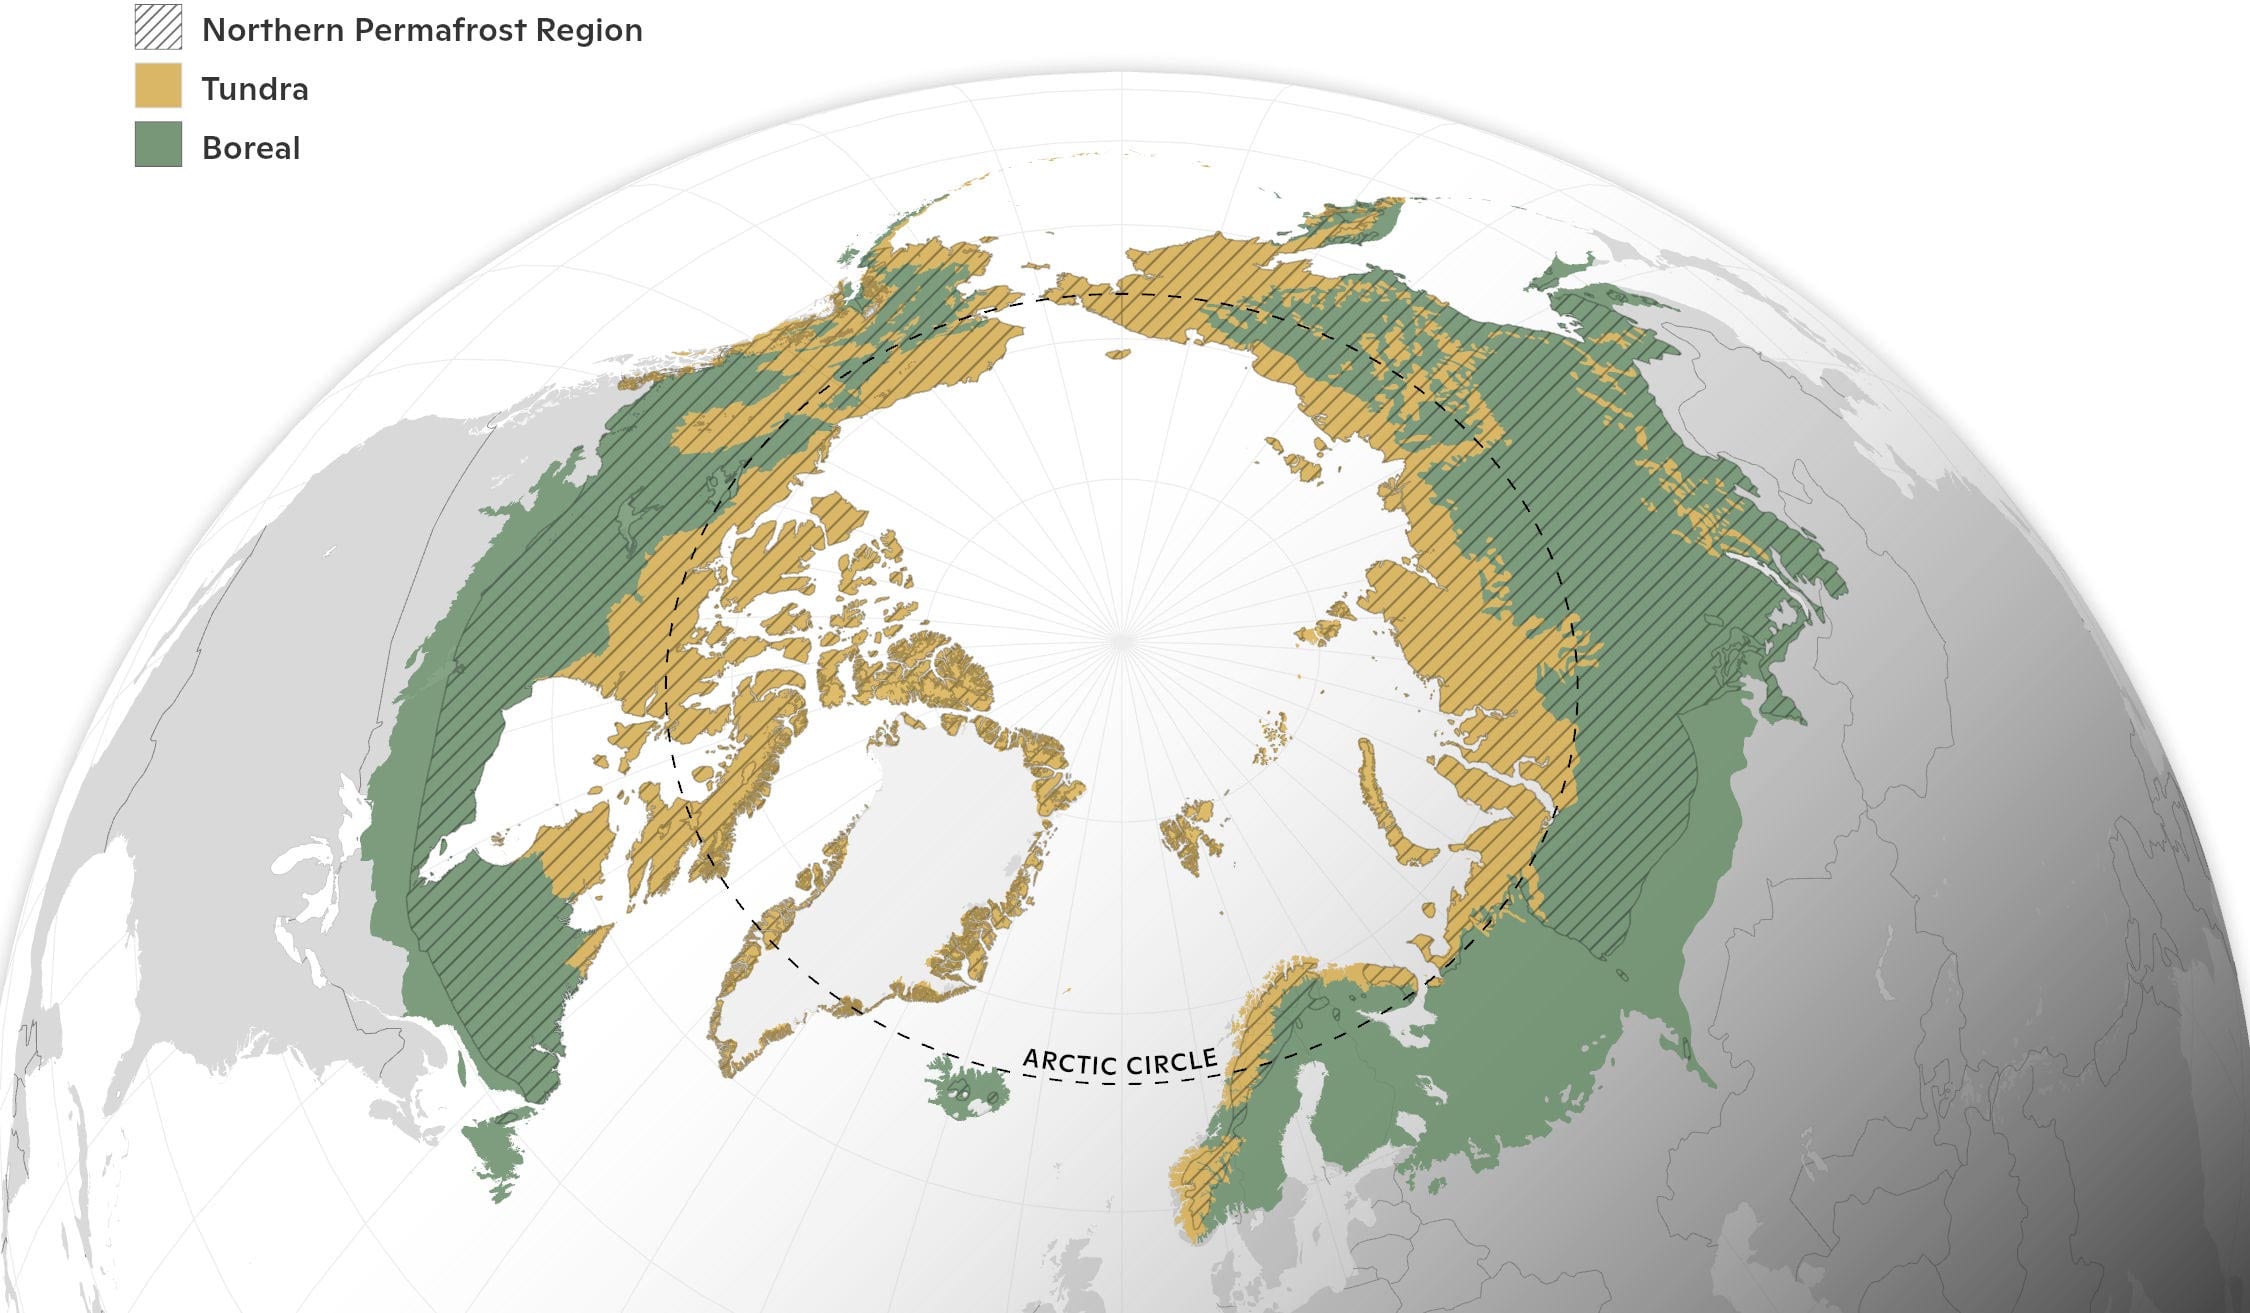
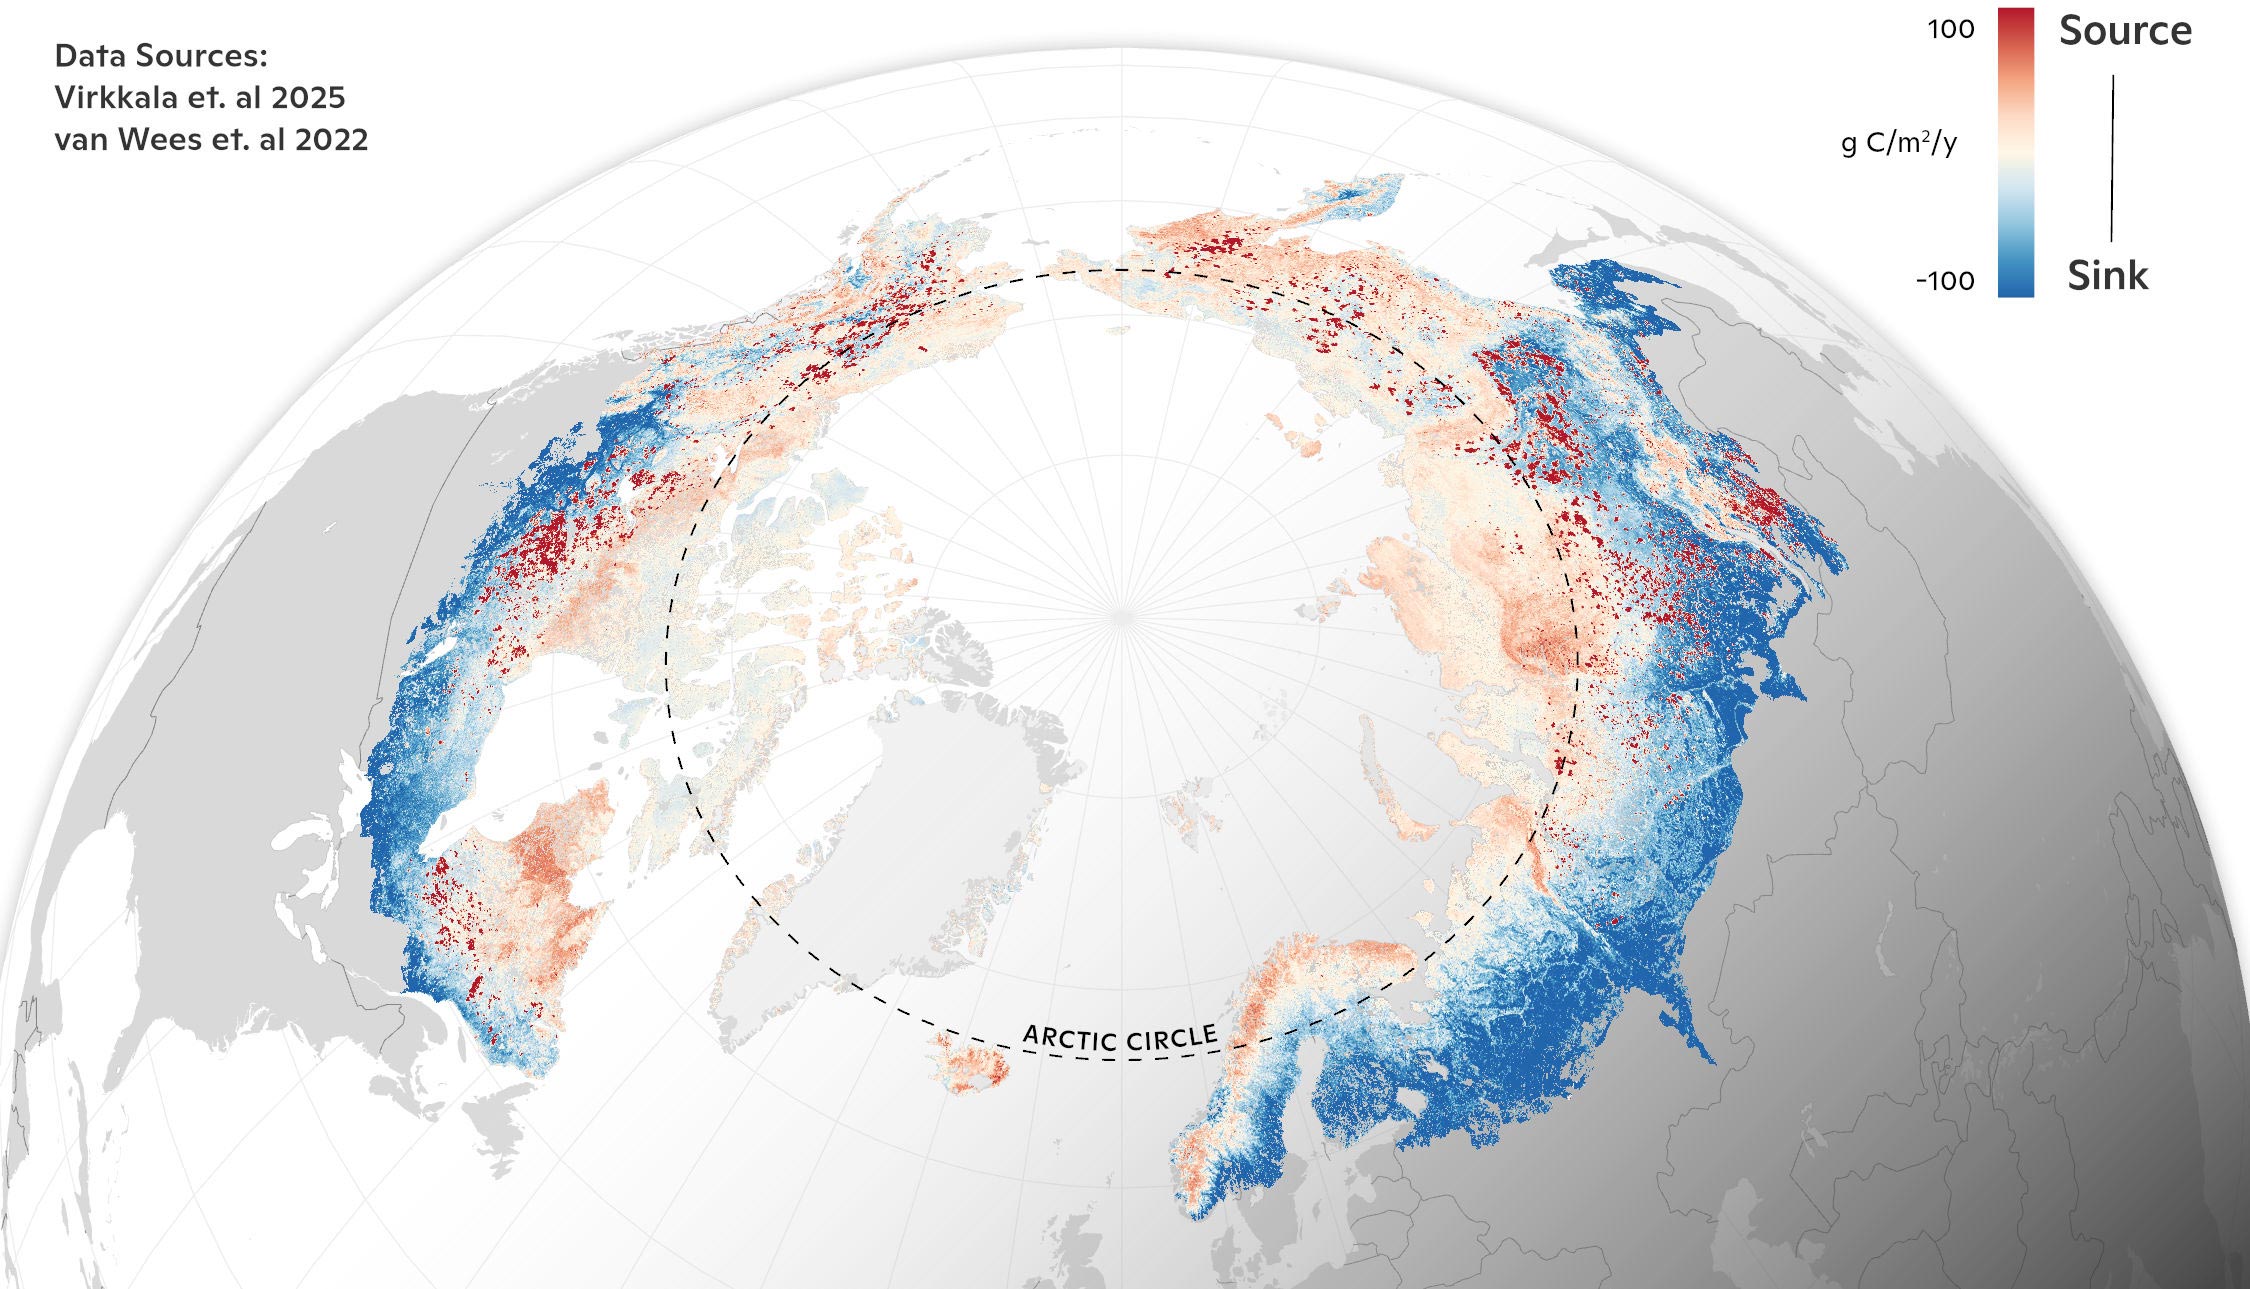
Researchers from the Woodwell Climate Research Center found that 34 percent of the Arctic-boreal zone (ABZ)—which includes tundra, boreal forests, and wetlands across Earth’s northern regions—has now become a carbon source rather than a sink. This shift occurs because while plants absorb carbon dioxide (CO2) through photosynthesis, microbial and plant respiration release it back into the atmosphere.
When emissions from wildfires were factored in, the study found that the percentage of the region acting as a carbon source increased to 40 percent.
Comprehensive Study Reveals Carbon Flux Dynamics
The findings represent the most current and comprehensive assessment of carbon fluxes in the ABZ to date. Drawing on a library of CO2 data four times as large as earlier upscaling efforts gathered from 200 study sites from 1990-2020, the analysis captures both year-round dynamics and important recent shifts in climate and northern fire regimes that have altered the carbon balance in the north.
“We wanted to develop the most current and comprehensive picture of carbon in the north, and to do that, we knew we needed to account for fire’s growing carbon footprint in this region,” said Dr. Anna Virkkala, a research scientist at the Permafrost Pathways initiative at Woodwell Climate and lead author of the study. “While we found many northern ecosystems are still acting as carbon dioxide sinks, source regions and fires are now canceling out much of that net uptake and reversing long-standing trends.”
Mapping the Carbon Footprint
The study is a robust record of how land in the northern latitudes is breathing—measuring the gasses it releases and pulls down from the atmosphere. Data are gathered at carbon flux monitoring towers and chambers, which track gas exchange between the land and the atmosphere.
These data are stored and analyzed in a comprehensive and growing library dubbed “ABC Flux,” which Virkkala helms. ‘Upscaling’ refers to the process by which these individual site-level readings are knitted together with climate, soil, and vegetation records to produce living maps of Earth’s otherwise invisible exhalations and inhalations.
By tracking monthly records over three decades, the Nature Climate Change study helps illustrate the “why” behind the trends: for instance, carbon uptake in the summers has increased over the 30 years, but more carbon emissions are being released from the tundra during the non-growing season months.
High-Resolution Data Sheds Light on Carbon Variability
Another advantage this study offers is relatively high resolution—1km x 1km for 2001-2020—allowing the researchers to map the “where” shaping these trendlines.
“The high resolution of these data means that we can now see how variable the Arctic is when it comes to carbon,” said Dr. Sue Natali, a co-author on the study and lead of Permafrost Pathways at Woodwell Climate. “That variability isn’t surprising because the Arctic isn’t one single place—it’s a massive area with diverse ecosystems and climatic conditions. And now we have the capability to track and map carbon processes at a spatial resolution that can reveal what’s happening on the ground.”
“We are seeing that longer growing seasons and more microbial activity in winter are gradually shifting carbon trajectories,” said Dr. Marguerite Mauritz, assistant professor at the University of Texas-El Paso and co-author of the study. “Highly collaborative efforts like this are critical for understanding how shifting seasonal dynamics and disturbance patterns can have regional and even global impacts.”
Northern Carbon Budgets Under Scrutiny
The latest findings add to a growing ensemble of recent studies that show how carbon budgets in the North are changing after the region’s historical role as a sink. While this study focused on CO2 fluxes on land, other recent results that count CO2 and methane (CH4) emissions from lakes, rivers, and wetlands also found the permafrost region to be a carbon source.
But the recent cache of upscaling results tells similar stories: namely, that trendlines in the northern latitudes are beginning to turn, and a warmer, greener Arctic does not reliably translate to more carbon storage there—in part because warmer has meant emissions from permafrost thaw and greener, more carbon to combust.
A Warning Sign for the Future
For example, the Nature Climate Change study found that while 49 percent of the ABZ region experienced “greening”—in which longer growing seasons and more vegetation means that more carbon can be photosynthesized and stored—only 12 percent of those greening pixels on the map showed an annual increasing net uptake of CO2.
“Carbon cycling in the permafrost region is really starting to change,” Virkkala said. “Our study may act as a warning sign of bigger changes ahead, and offers a map of places we’ll need to better monitor in the coming decades.”
Reference: “Wildfires offset the increasing but spatially heterogeneous Arctic–boreal CO2 uptake” by Anna-Maria Virkkala, Brendan M. Rogers, Jennifer D. Watts, Kyle A. Arndt, Stefano Potter, Isabel Wargowsky, Edward A. G. Schuur, Craig R. See, Marguerite Mauritz, Julia Boike, M. Syndonia Bret-Harte, Eleanor J. Burke, Arden Burrell, Namyi Chae, Abhishek Chatterjee, Frederic Chevallier, Torben R. Christensen, Roisin Commane, Han Dolman, Colin W. Edgar, Bo Elberling, Craig A. Emmerton, Eugenie S. Euskirchen, Liang Feng, Mathias Göckede, Achim Grelle, Manuel Helbig, David Holl, Järvi Järveoja, Sergey V. Karsanaev, Hideki Kobayashi, Lars Kutzbach, Junjie Liu, Ingrid T. Luijkx, Efrén López-Blanco, Kyle Lunneberg, Ivan Mammarella, Maija E. Marushchak, Mikhail Mastepanov, Yojiro Matsuura, Trofim C. Maximov, Lutz Merbold, Gesa Meyer, Mats B. Nilsson, Yosuke Niwa, Walter Oechel, Paul I. Palmer, Sang-Jong Park, Frans-Jan W. Parmentier, Matthias Peichl, Wouter Peters, Roman Petrov, William Quinton, Christian Rödenbeck, Torsten Sachs, Christopher Schulze, Oliver Sonnentag, Vincent L. St. Louis, Eeva-Stiina Tuittila, Masahito Ueyama, Andrej Varlagin, Donatella Zona and Susan M. Natali, 21 January 2025, Nature Climate Change.
DOI: 10.1038/s41558-024-02234-5
This work was funded by the Gordon and Betty Moore Foundation and funding catalyzed through the TED Audacious Project for Permafrost Pathways: Connecting Science, People, and Policy for Arctic Justice and Global Climate.
Never miss a breakthrough: Join the SciTechDaily newsletter.
Follow us on Google and Google News.
3 Comments
Something that should be obvious, but wasn’t mentioned, is that boreal wildfires significantly reduce the available fuel, create natural fire-breaks, and reduce the probability of future fires for several years. The result is that an increase in CO2 from fires results in an unsustainable, temporary CO2-emissions increase that is not representative of the long-term future. That is, recent increases will probably be followed by future decreases.
Also, I’m left with the impression that the multi-year CO2 map shows a net sequestration of CO2, particularly in eastern Asian boreal forests. The YouTube seasonal-CO2 animation for the last 20-years doesn’t suggest, at least to me, anything different from the Mauna Loa Observatory (MLO) record. That is, I don’t see the tundra looking much different from the boreal forests in the seasonal changes. It should also be noted that the Fall through Spring seasonal ramp-up phase is in sync with the general northern hemisphere behavior, and there is no net increase in CO2 during the Summer when the tundra is experiencing melting.
If their concerns about the Arctic Boreal Zone are valid, are we seeing it reflected in the MLO measurements?
I would suggest that, in the future, the authors focus on a different approach in analyzing and displaying their measurements. Instead of using the ANNUAL average (net) changes, plot the seasonal changes to distinguish between the regime changes of net emissions and net sequestration (sink). I think that will help them in untangling the confounding factors of emissions and withdrawals happening simultaneously during the Summer growing season, and help them hone in on their concern about Summer melting and fires increasing CO2 emissions.
I don’t think that the title of this article accurately reflects the findings of the research.