The motion of stars in the outskirts of our galaxy hints at significant changes in the history of the Milky Way. This and other equally fascinating results come from a set of papers that demonstrate the quality of ESA’s Gaia Early third Data Release (EDR3), which is made public on December 3, 2020.
Astronomers from the Gaia Data Processing and Analysis Consortium (DPAC) saw the evidence of the Milky Way’s past by looking at stars in the direction of the galaxy’s ‘anticenter.’ This is in the exact opposite direction on the sky from the center of the galaxy.
The results on the anticenter come from one of the four ‘demonstration papers’ released alongside the Gaia data. The others use Gaia data to provide a huge extension to the census of nearby stars, derive the shape of the Solar System’s orbit around the center of the galaxy, and probe structures in two nearby galaxies to the Milky Way. The papers are designed to highlight the improvements and quality of the newly published data.
What’s new in EDR3?
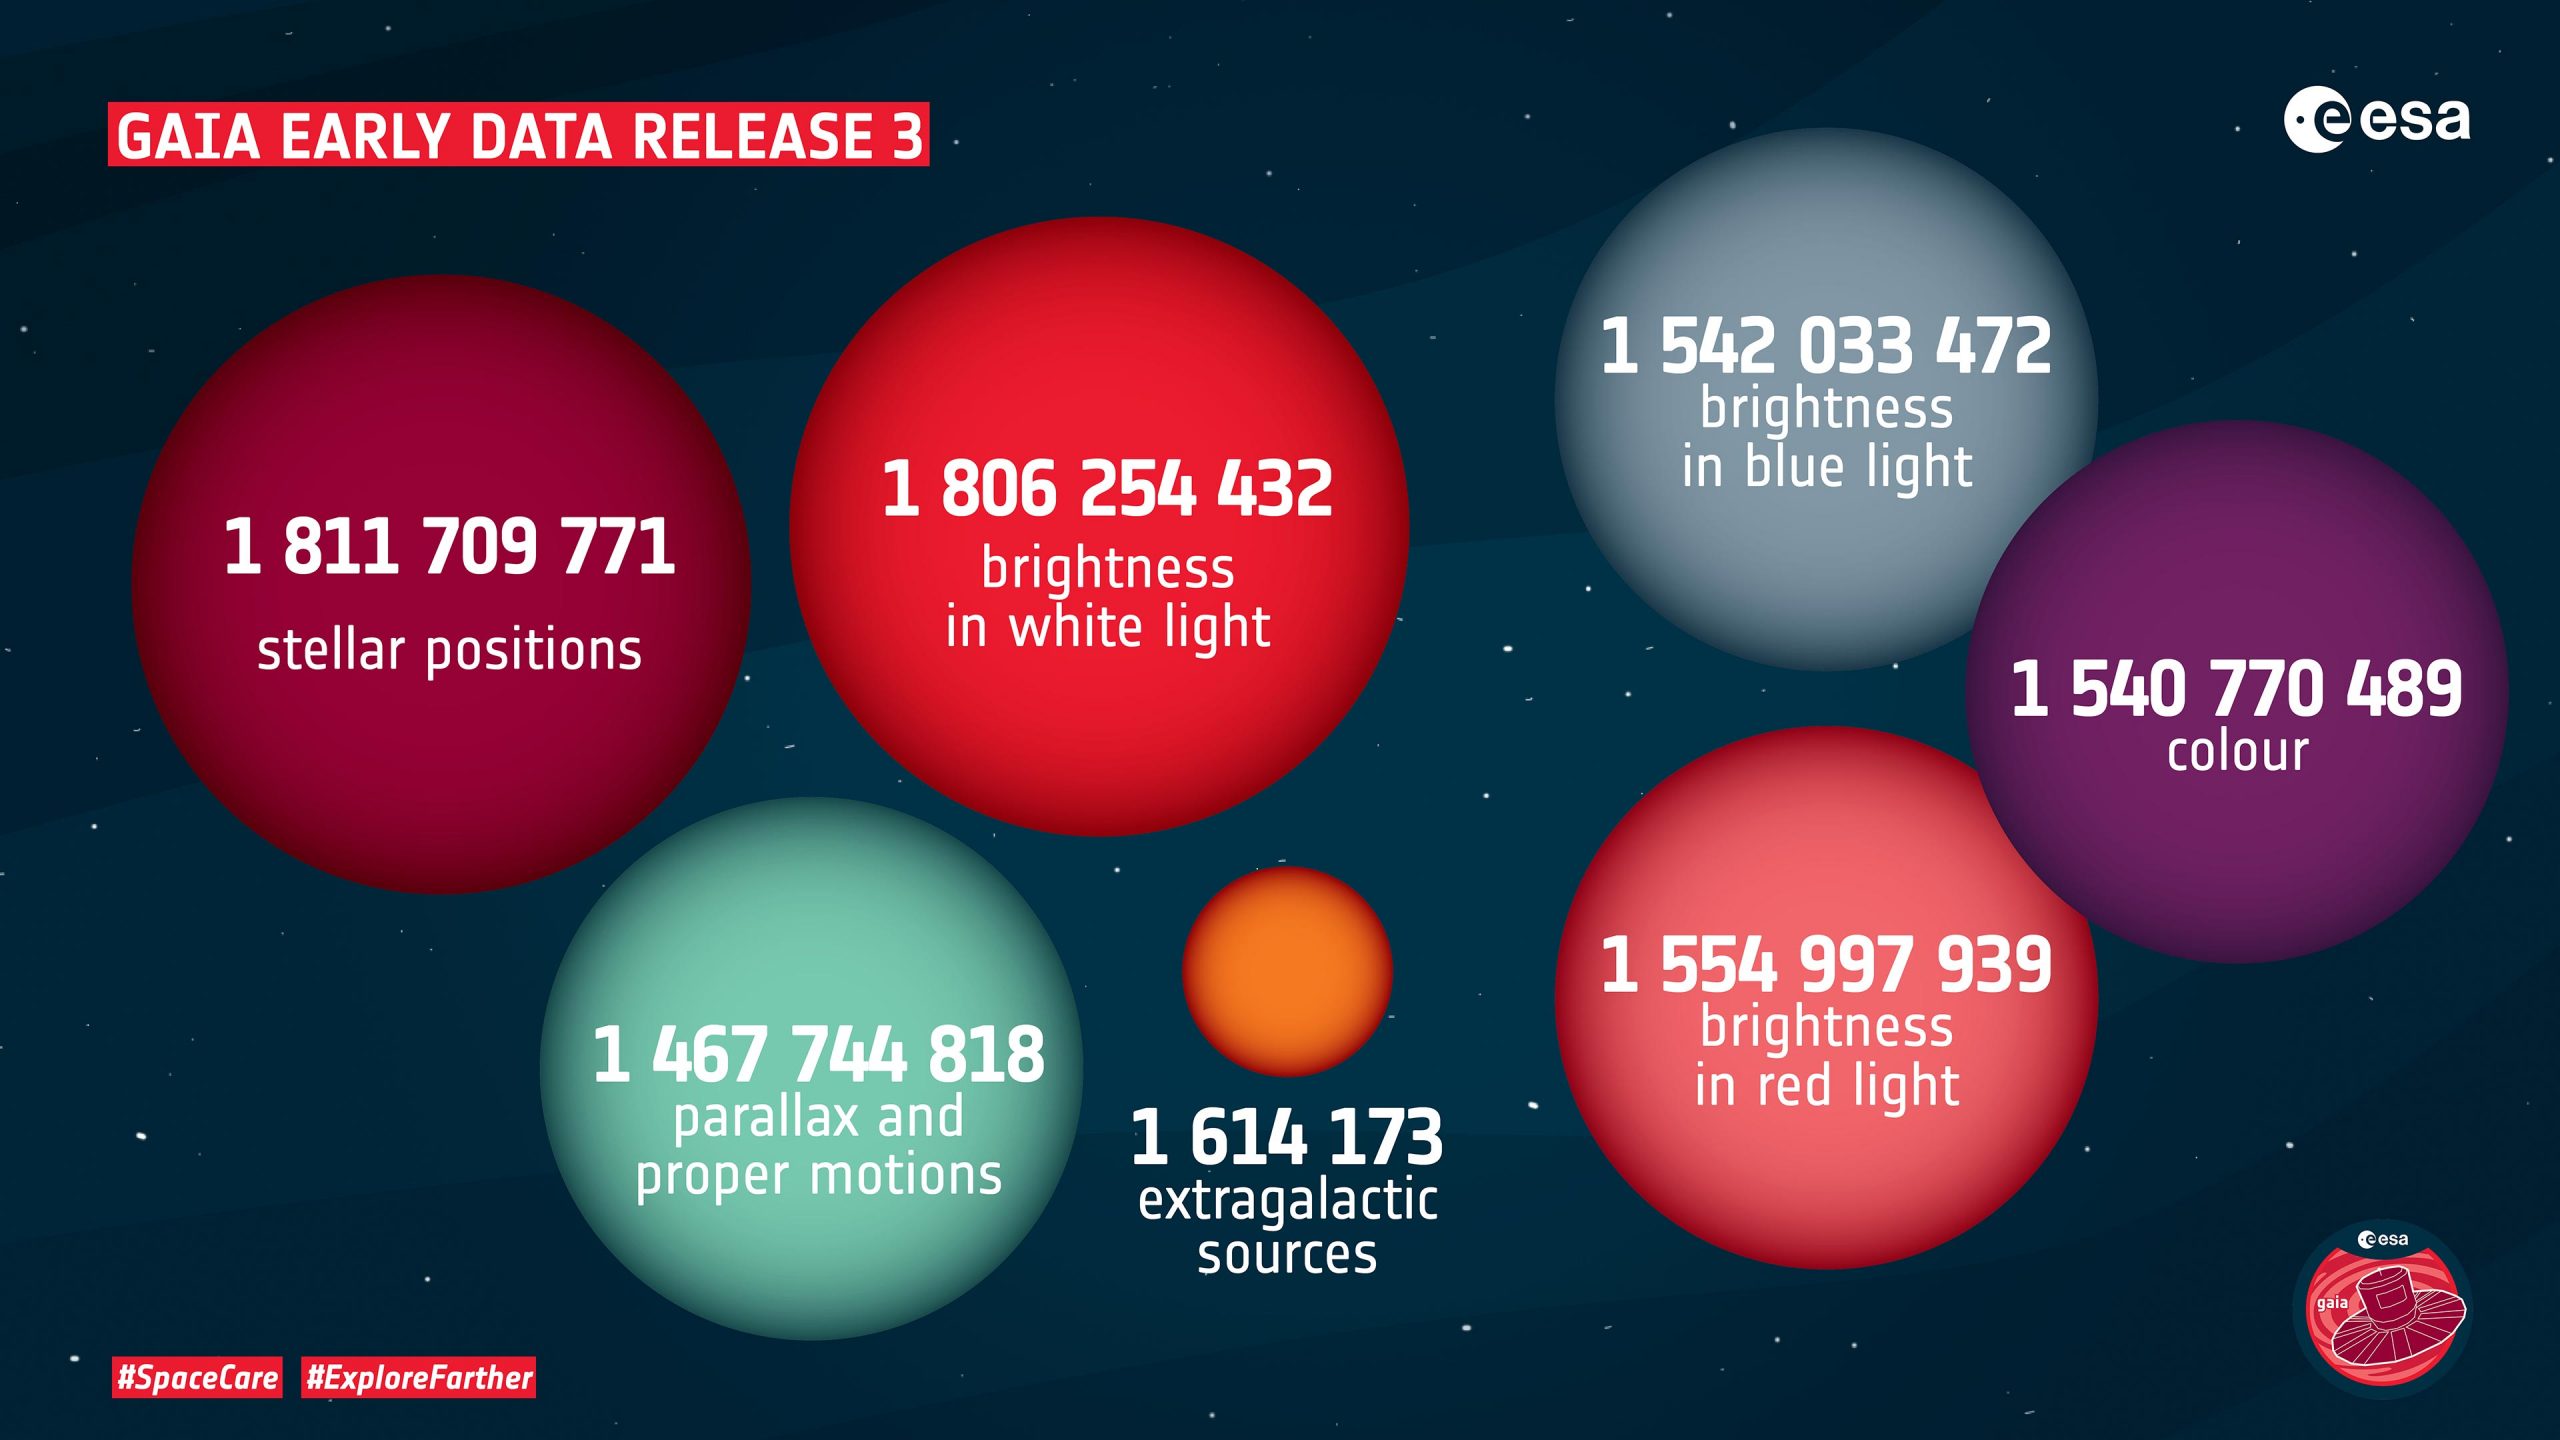
Gaia EDR3 contains detailed information on more than 1.8 billion sources, detected by the Gaia spacecraft. This represents an increase of more than 100 million sources over the previous data release (Gaia DR2), which was made public in April 2018. Gaia EDR3 also contains color information for around 1.5 billion sources, an increase of about 200 million sources over Gaia DR2. As well as including more sources, the general accuracy and precision of the measurements have also improved.
“The new Gaia data promise to be a treasure trove for astronomers,” says Jos de Bruijne, ESA’s Gaia Deputy Project Scientist.

To the galactic anticenter
The new Gaia data have allowed astronomers to trace the various populations of older and younger stars out towards the very edge of our galaxy – the galactic anticenter. Computer models predicted that the disc of the Milky Way will grow larger with time as new stars are born. The new data allow us to see the relics of the 10 billion-year-old ancient disc and so determine its smaller extent compared to the Milky Way’s current disc size.
The new data from these outer regions also strengthen the evidence for another major event in the more recent past of the galaxy.
The data show that in the outer regions of the disc there is a component of slow-moving stars above the plane of our galaxy that are heading downwards towards the plane, and a component of fast-moving stars below the plane that are moving upwards. This extraordinary pattern had not been anticipated before. It could be the result of the near-collision between the Milky Way and the Sagittarius dwarf galaxy that took place in our galaxy’s more recent past.
The Sagittarius dwarf galaxy contains a few tens of millions of stars and is currently in the process of being cannibalized by the Milky Way. Its last close pass to our galaxy was not a direct hit, but this would have been enough so that its gravity perturbed some stars in our galaxy like a stone dropping into water.

Using Gaia DR2, members of DPAC had already found a subtle ripple in the movement of millions of stars that suggested the effects of the encounter with Sagittarius sometime between 300 and 900 million years ago. Now, using Gaia EDR3, they have uncovered more evidence that points to its strong effects on our galaxy’s disc of stars.
“The patterns of movement in the disc stars are different to what we used to believe,” says Teresa Antoja, University of Barcelona, Spain, who worked on this analysis with DPAC colleagues. Although the role of the Sagittarius dwarf galaxy is still debated in some quarters, Teresa says, “It could be a good candidate for all these disturbances, as some simulations from other authors show.”
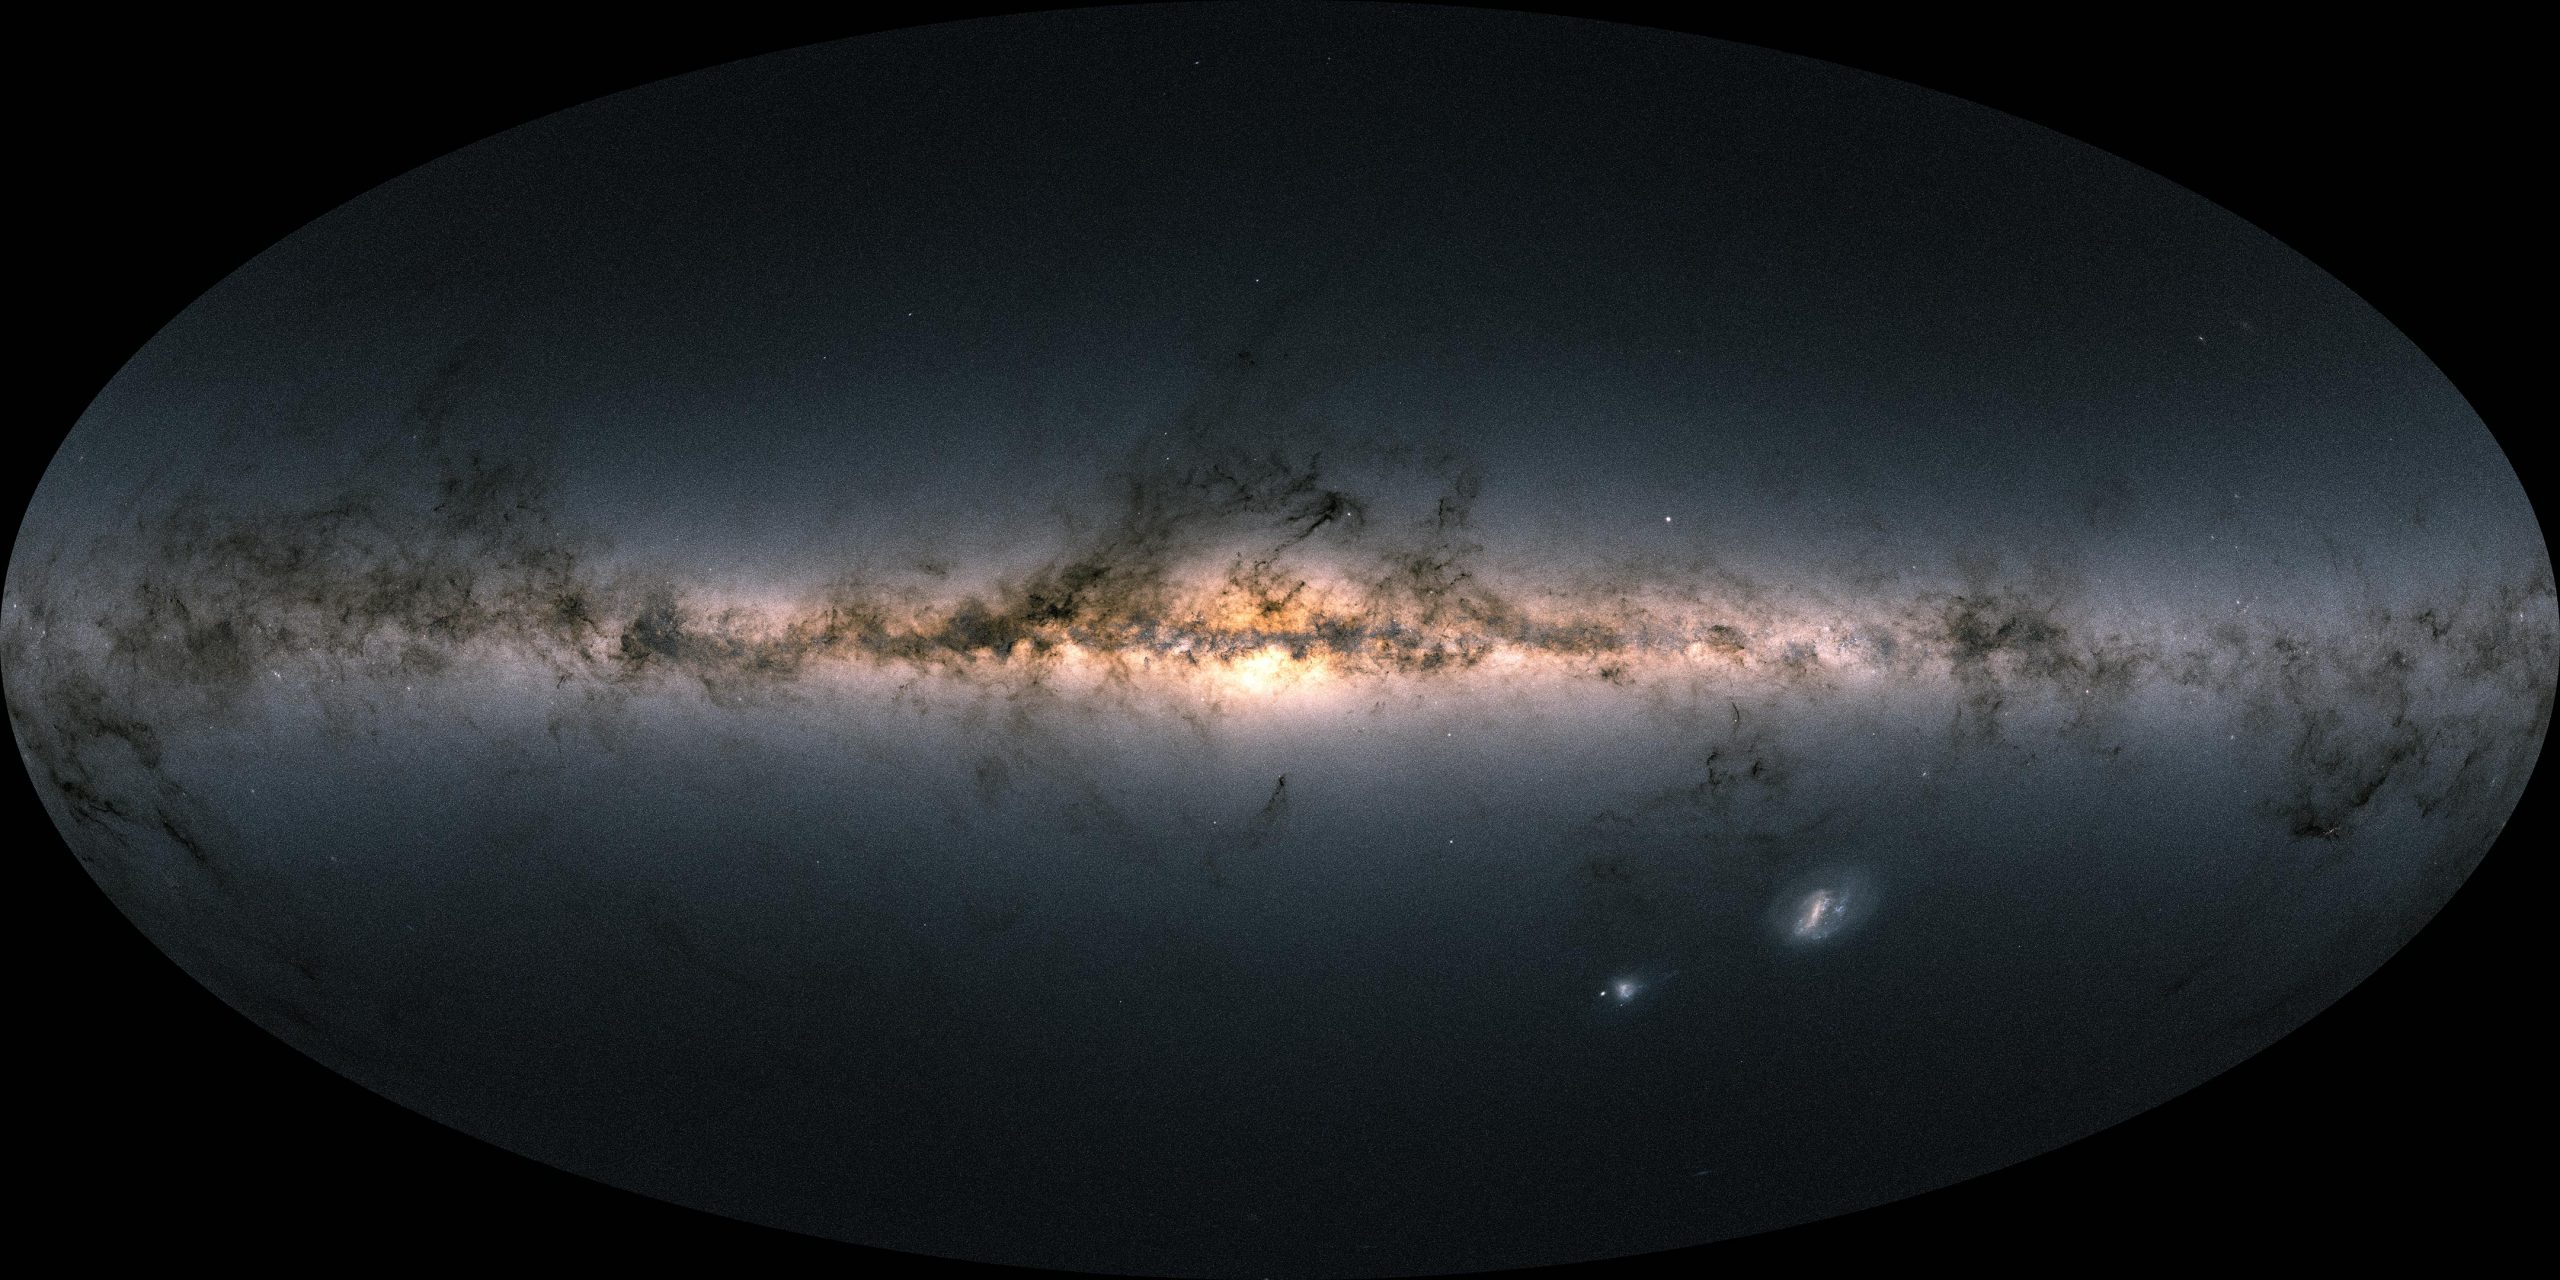
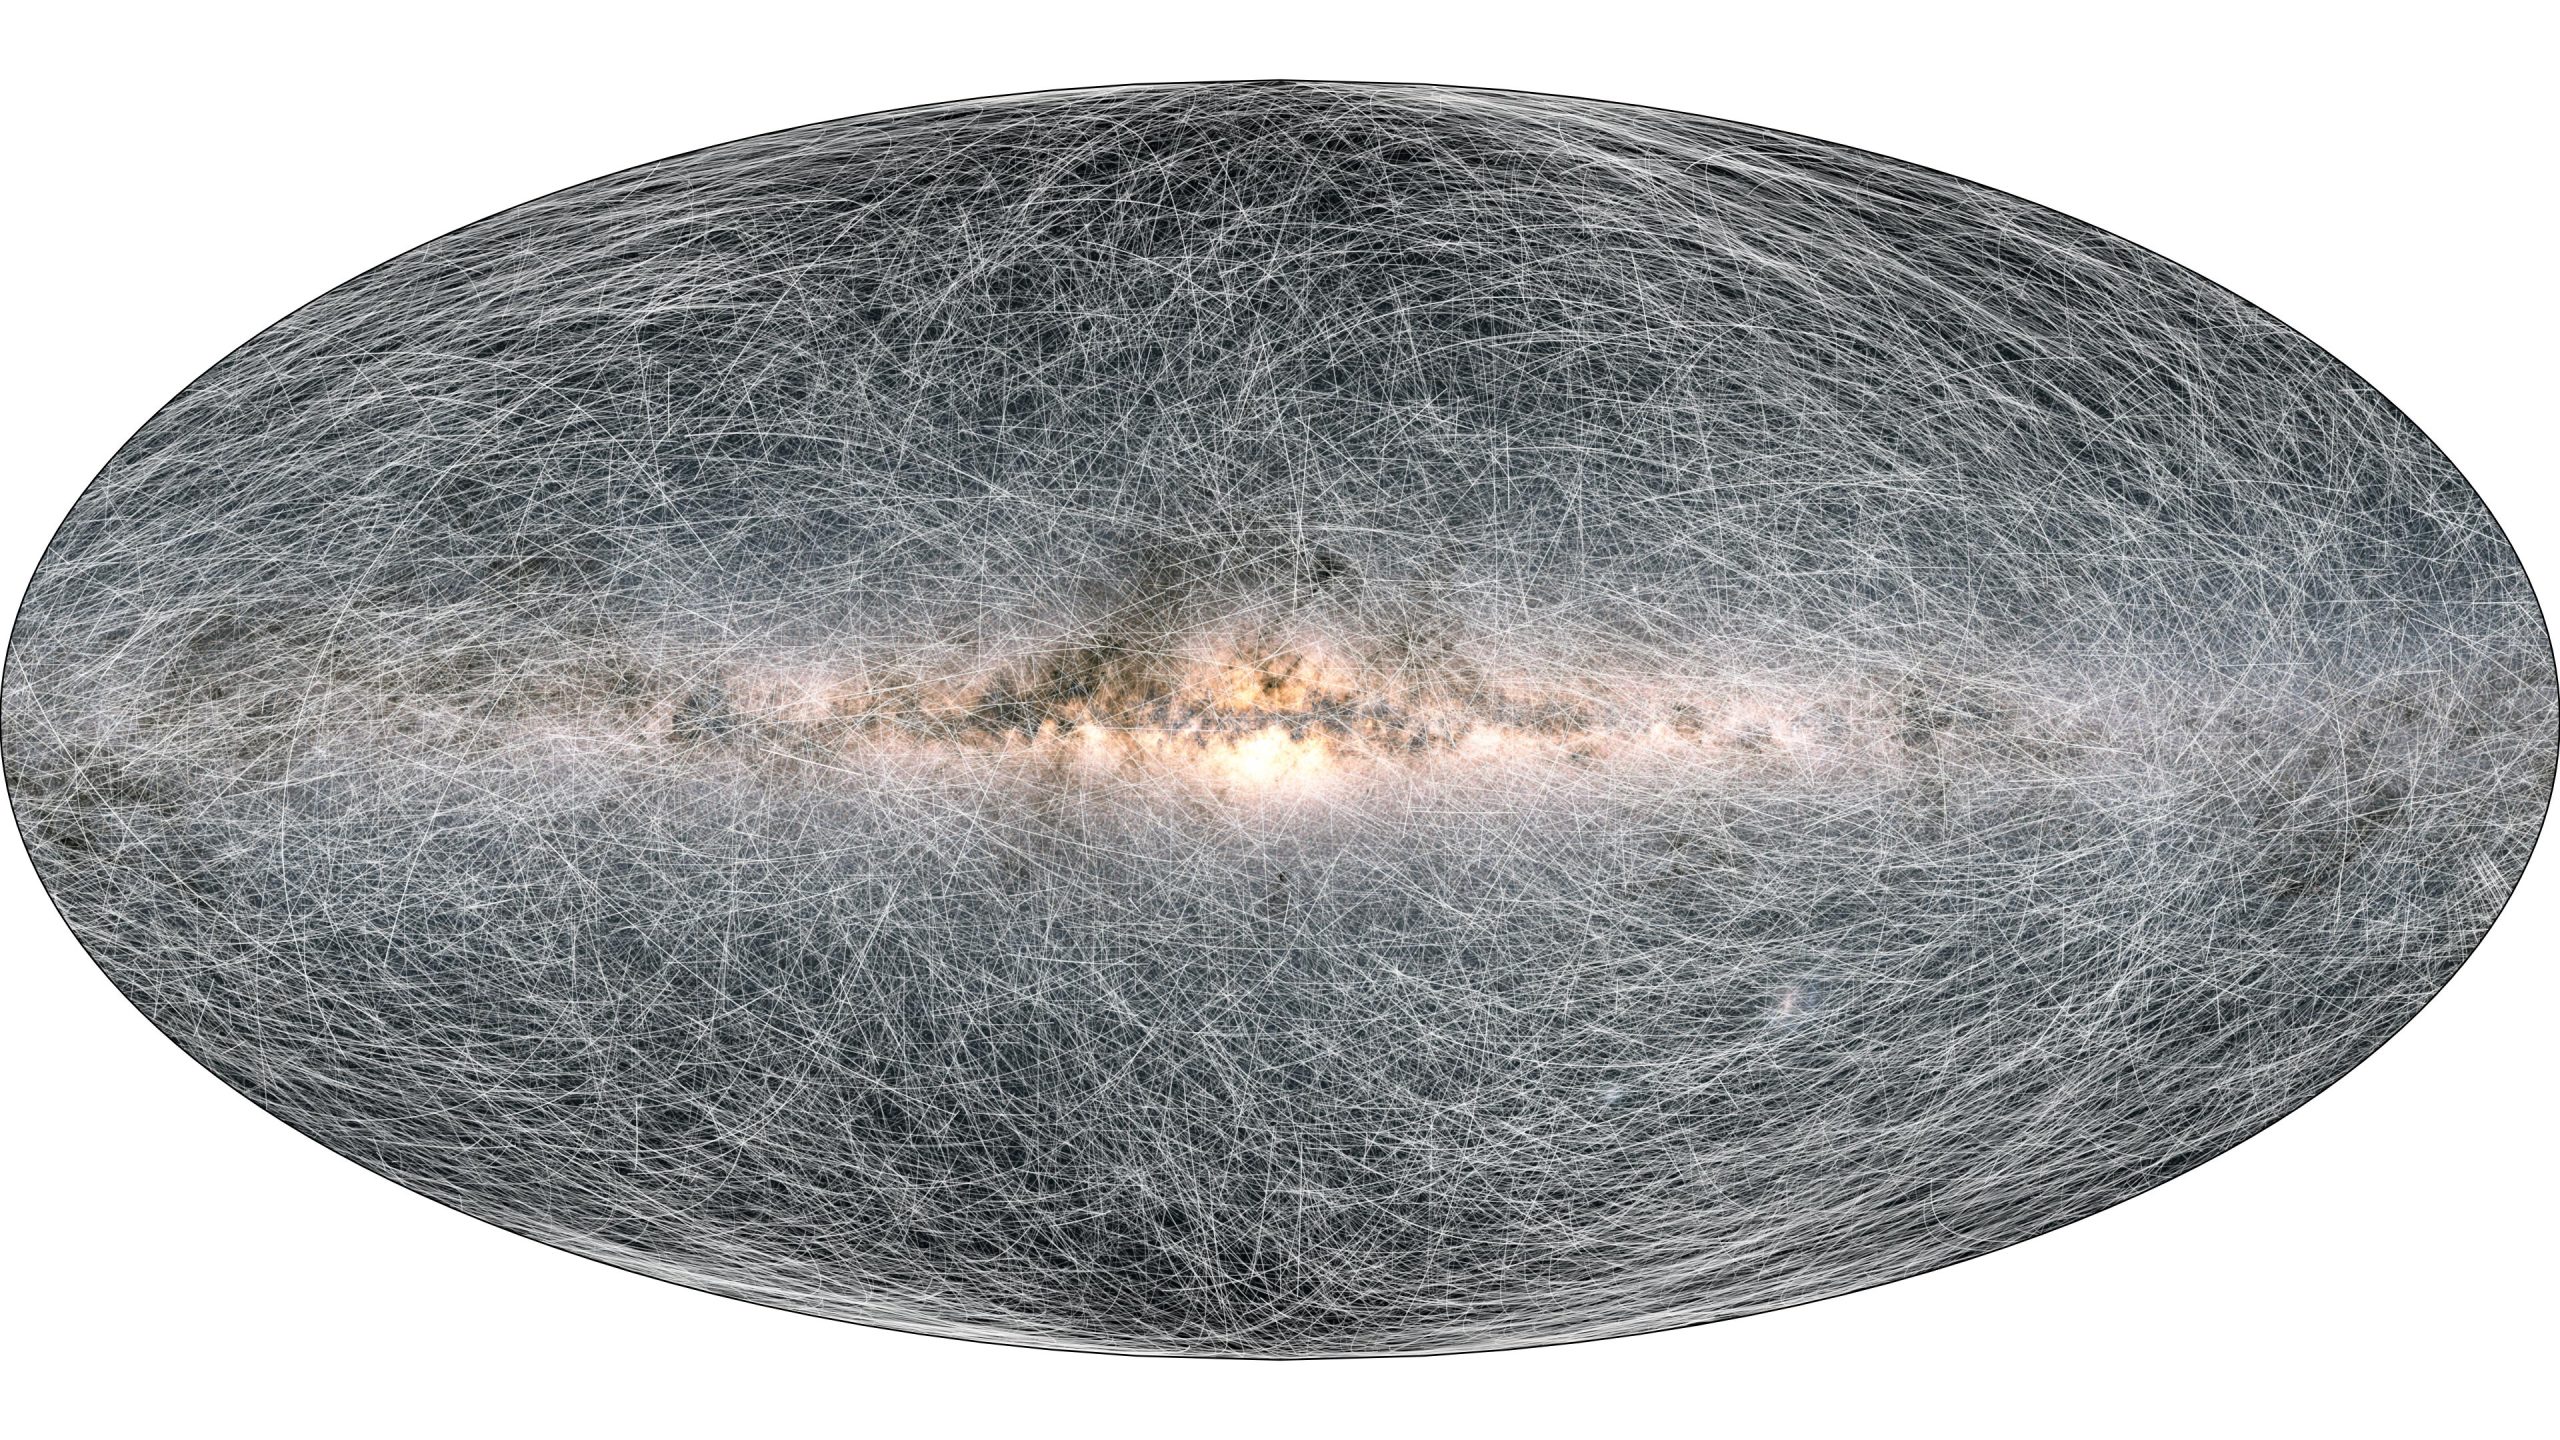
Brighter regions represent denser concentrations of bright stars, while darker regions correspond to patches of the sky where fewer and fainter stars are observed. The color of the image is obtained by combining the total amount of light with the amount of blue and red light recorded by Gaia in each patch of the sky. The bright horizontal structure that dominates the image is the plane of our Milky Way galaxy. It is actually a flattened disc seen edge-on that contains most of the galaxy’s stars. In the middle of the image, the Galactic center appears bright, and thronged with stars. Credit: ESA/Gaia/DPAC; CC BY-SA 3.0 IGO. Acknowledgment: A. Moitinho.
Measuring the Solar System’s orbit
The history of the galaxy is not the only result from the Gaia EDR3 demonstration papers. DPAC members across Europe have performed other work to demonstrate the extreme fidelity of the data and the unique potential for unlimited scientific discovery.
In one paper, Gaia has allowed scientists to measure the acceleration of the Solar System with respect to the rest frame of the Universe. Using the observed motions of extremely distant galaxies, the velocity of the Solar System has been measured to change by 0.23 nm/s every second. Because of this tiny acceleration, the trajectory of the Solar System is deflected by the diameter of an atom every second, and in a year this adds up to around 115 km. The acceleration measured by Gaia shows a good agreement with the theoretical expectations and provides the first measurement of the curvature of the Solar System’s orbit around the galaxy in the history of optical astronomy.
A new stellar census
Gaia EDR3 has also allowed a new census of stars in the solar neighborhood to be obtained. The Gaia Catalogue of Nearby Stars contains 331 312 objects, which is estimated to be 92 percent of the stars within 100 parsecs (326 light-years) of the Sun. The previous census of the solar neighborhood, called the Gliese Catalogue of Nearby Stars, was carried out in 1957. It possessed just 915 objects initially, but was updated in 1991 to 3803 celestial objects. It was also limited to a distance of 82 light-years: Gaia’s census reaches four times farther and contains 100 times more stars. It also provides location, motion, and brightness measurements that are orders of magnitude more precise than the old data.
Beyond the Milky Way
A fourth demonstration paper analyzed the Magellanic Clouds: two galaxies that orbit the Milky Way. Having measured the movement of the Large Magellanic Cloud’s stars to greater precision than before, Gaia EDR3 clearly shows that the galaxy has a spiral structure. The data also resolve a stream of stars that is being pulled out of the Small Magellanic Cloud, and hints at previously unseen structures in the outskirts of both galaxies.
At 12:00 CET on December 3, the data produced by the many scientists and engineers of the Gaia DPAC Consortium become public for anyone to look at and learn from. This is the first of a two-part release; the full Data Release 3 is planned for 2022.
“Gaia EDR3 is the result of a huge effort from everyone involved in the Gaia mission. It’s an extraordinarily rich data set, and I look forward to the many discoveries that astronomers from around the world will make with this resource,” says Timo Prusti, ESA’s Gaia Project Scientist. “And we’re not done yet; more great data will follow as Gaia continues to make measurements from orbit.”
Never miss a breakthrough: Join the SciTechDaily newsletter.
Follow us on Google and Google News.
11 Comments
thank you
i read the following
1,811,709,771 stars exact position and brightness known
1,614,173 extragalatic sources
1,810,095,598 the milky way galactic anticenter allowing astromomers to trace various populations of older and younger stars out towards the edge of our galaxy
can you advise me of the infantry concerning these this cohort of 1,810,095,598
do esa have the enumeration of stars
10,000,000,000 years old
9,000,000,000 years old
8,000,000,000 years old
7,000,000,000 years old
6,000,000,000 years old
5,000,000,000 years old
4,567,000,000 years old x 1 our solar sun
4,000,000,000 years old
3,000,000,000 years old
2,000,000,000 years old
1,000,000,000 years old
500,000,000 years old
100,000,000 years old
if yoyr computer hal could oblige i would be delighted to know
Extremely Interesting Research and findings.
Here are someimmediate thoughts which come up for Consideration and future experiments.
1. If I recall correctly , Even our Earth exists at the Fringe of The Galaxy and revolves around the Sun ( Our Personal Star) which gives us Life.
2. All these Stars and the Planets Revolving around them should be the focus of future research after a baseline which is extremely accurate is developed (as Ihave already recommended earlier) to Search for Extra-terrestrial life which are similar to ours. Ofcourse there may be other Life Forms at the Centre of the Glaxy which appears to have a black hole gobbling up the neighbourhood! Caution is advised . Pleasedo not Make Contact as they may be unfriendly and a fldgling civilization based on Science may be extinguished ny such life forms.
Some way out thoughts for Consideration which I have always wondered about.
1. Why do people of Vedic Heritage ( labelled as Hindus by the Colonial Masters!) like me Consider the Holy Fire – Agni as a witness when they get hitched / Married and take seven STEPS /circles around the Holy Fire. The First Three the male leads and the FEmale follows. The next Four the Femael Leads and the Groom holds her feet and helps when they take their Seven Steps / Circles and wedding vows —– and the belief that All the Gods are present and witnessing the Holy Matrimony at this once in a lifetime event now repeated on a n frequent basis in the world for petty reasonsas a result of Laws and divorce granted by Judiciary for rasons best known to them. After all, I do not know of any Couple who do not have disagreements and fights and all out battles sometimes. However the ones who make it throgh theselive a happy and fulfilled life till a ripe old age!! .
Maybe the Glalaxy Center , with its black hole gobbing up its neighbourhood is giving birth to other universes , which we haven’t yet got data to prove. However the mathematics of this hypothesis and theory cn be proved and/or developed, once sufficient data exists..
2. I also always wondered why The Zorastrian Faith Considers the Holy Fire Sacred and it is present and safely guarded by the Priests and Worshipped with reverance in their Agiary’s. By theway , they also practise the most environmental friendly way of disposing of the bodies of the dearly departed where the dead bodies after lastrites are acrried out are taken to the “Towers of Silence” and left for the Vultures and Other Creatures of the Ar to consume the dead flesh and the burning sun!!
3. From Greek “Mythology” we have often heard about Prometheus who “stole” FIRE and brought it to Humanity as a Gift !. Thank Promethus for Humanity and the extraodinary development of the Human Brain , thanks to cooked food. I wonder hoq many of us would fancy eating raw meat , which all our common ancestors probably did — when we were not any diifferent from the animals!
We Still enjoy a Salad — which is raw vegetables but are advised to not eat it at weddings and other meetings and parties as it may not be appropriately washed to remove unfriendly bacteria, pathogens and Viruses , which ensures Doctors and Scientists doing Research are kept busy fixing illnesses -as these unfriendly creatures jump to humans from other mammals, as well as other unfriendly creatures like mosquitoes , flies etc.!!.
The Views expressed above are Personal and not binding on others . However , I remember reading that Meat dulls the mind and maybe Human Progress can be put on a fast track with adoption of a better and less harmful diet , which is not extreme and ensures inclusion of apropriate vitamins and othe supplementsband minerals required in minute quantities needed to keep the brain functioning at Peak Efficiency. Think about it.
Suggestions and Opinions expressed are NOt Binding on Others and are Personal,
Hey, if the solar system is deflected by .23nm/s/s, then the total deflection over the course of a year (.00000000023m * 60 seconds * 525,600 minutes – which, everyone knows, measures a year) would be .00725m, roughly, or about three quarters of a cm. That’s slower than plate tectonics. Where does 115 km come from? It seems like the figure is off by a factor of, like, more than 15 million. What aren’t I getting?
@DS
Der Zahlenwert 0,23 nm / s / s ist eine Beschleunigung. Bei einer Kreisbewegung wirkt die Beschleunigung immer senkrecht auf die Bewegungsrichtung.
Diese Strecke kann man durch
s=0.5 * a * t^2 ermitteln. Damit ergibt sich für s in einem Jahr 114,369 km.
Ups, sorry Autokorrektur und ohne Vorschau auf dem Handy geschrieben schwer zu überprüfen.
@DS
Der Zahlenwert 0,23 nm / s / s ist eine Beschleunigung. Bei einer Kreisbewegung wirkt die Beschleunigung immer senkrecht auf die Bewegungsrichtung.
Diese Wegstrecke kann man durch
s = 0,5 * a * t ^ 2 ermitteln. Damit ergibt sich für s in einem Jahr ein Wert von 114,369 km. (114 km)
114 km!!
Eingabeformular ersetzt einfach meine Eingaben. 🙁
I c h h a s s e d i e s e s E i n g a b e f o r m u l a r.
Oh sorry It’s an English page and my phone translated it wrong afterwards.
I know your out there there 😏 life
What information did Gaia reveal on the number of white dwarfs e.g. in the Milky Way?