Scientists examined multiple fire danger indices for the contiguous U.S. to assess the impact of climate change on future wildfire risk and seasonality.
Wildfires are some of the most destructive natural disasters in the country, threatening lives, destroying homes and infrastructure, and creating air pollution. In order to properly forecast and manage wildfires, managers need to understand wildfire risk and allocate resources accordingly. A new study contributes scientific expertise to this effort.
Assessing Future Fire Risks
In the study, published in the November issue of the journal Earth’s Future, researchers from the Desert Research Institute (DRI), Argonne National Laboratory, and the University of Wisconsin-Madison, teamed up to assess future fire risk. They looked at the four fire danger indices used across North America to predict and manage the risk of wildfire to see how the risk correlated with observed wildfire size between 1984 and 2019. Then, they examined how wildfire risk changed under the projected future climate, finding that both fire potential and a longer wildfire season are likely under climate change.
Comprehensive Risk Evaluation
“We use several of these fire danger indices to evaluate fire risk in the contiguous U.S.,” said Guo Yu, Ph.D., assistant research professor at DRI and lead author of the study. “But previous studies have only looked at how climate change will alter wildfire risk using one of them, and only a few studies have looked at how fire risk has translated to the size or characteristics of actual wildfires. We wanted to rigorously assess both in this paper.”
Fire danger indices use information about weather conditions and fuel moisture, or how dry vegetation is on the ground. The most common fire danger indices used in North America are the USGS Fire Potential Index, the Canadian Forest Fire Weather Index, and the Energy Release Component and Burning Indices from the National Fire Danger Rating System.
Correlation and Climate Projections
First, the scientists used satellite remote sensing data from 1984-2019 to see how potential fire risk correlated with ultimate wildfire size for more than 13,000 wildfires, excluding controlled burns. They found that when wildfire risk was higher, wildfire size tended to be larger, and this relationship was stronger over larger areas.
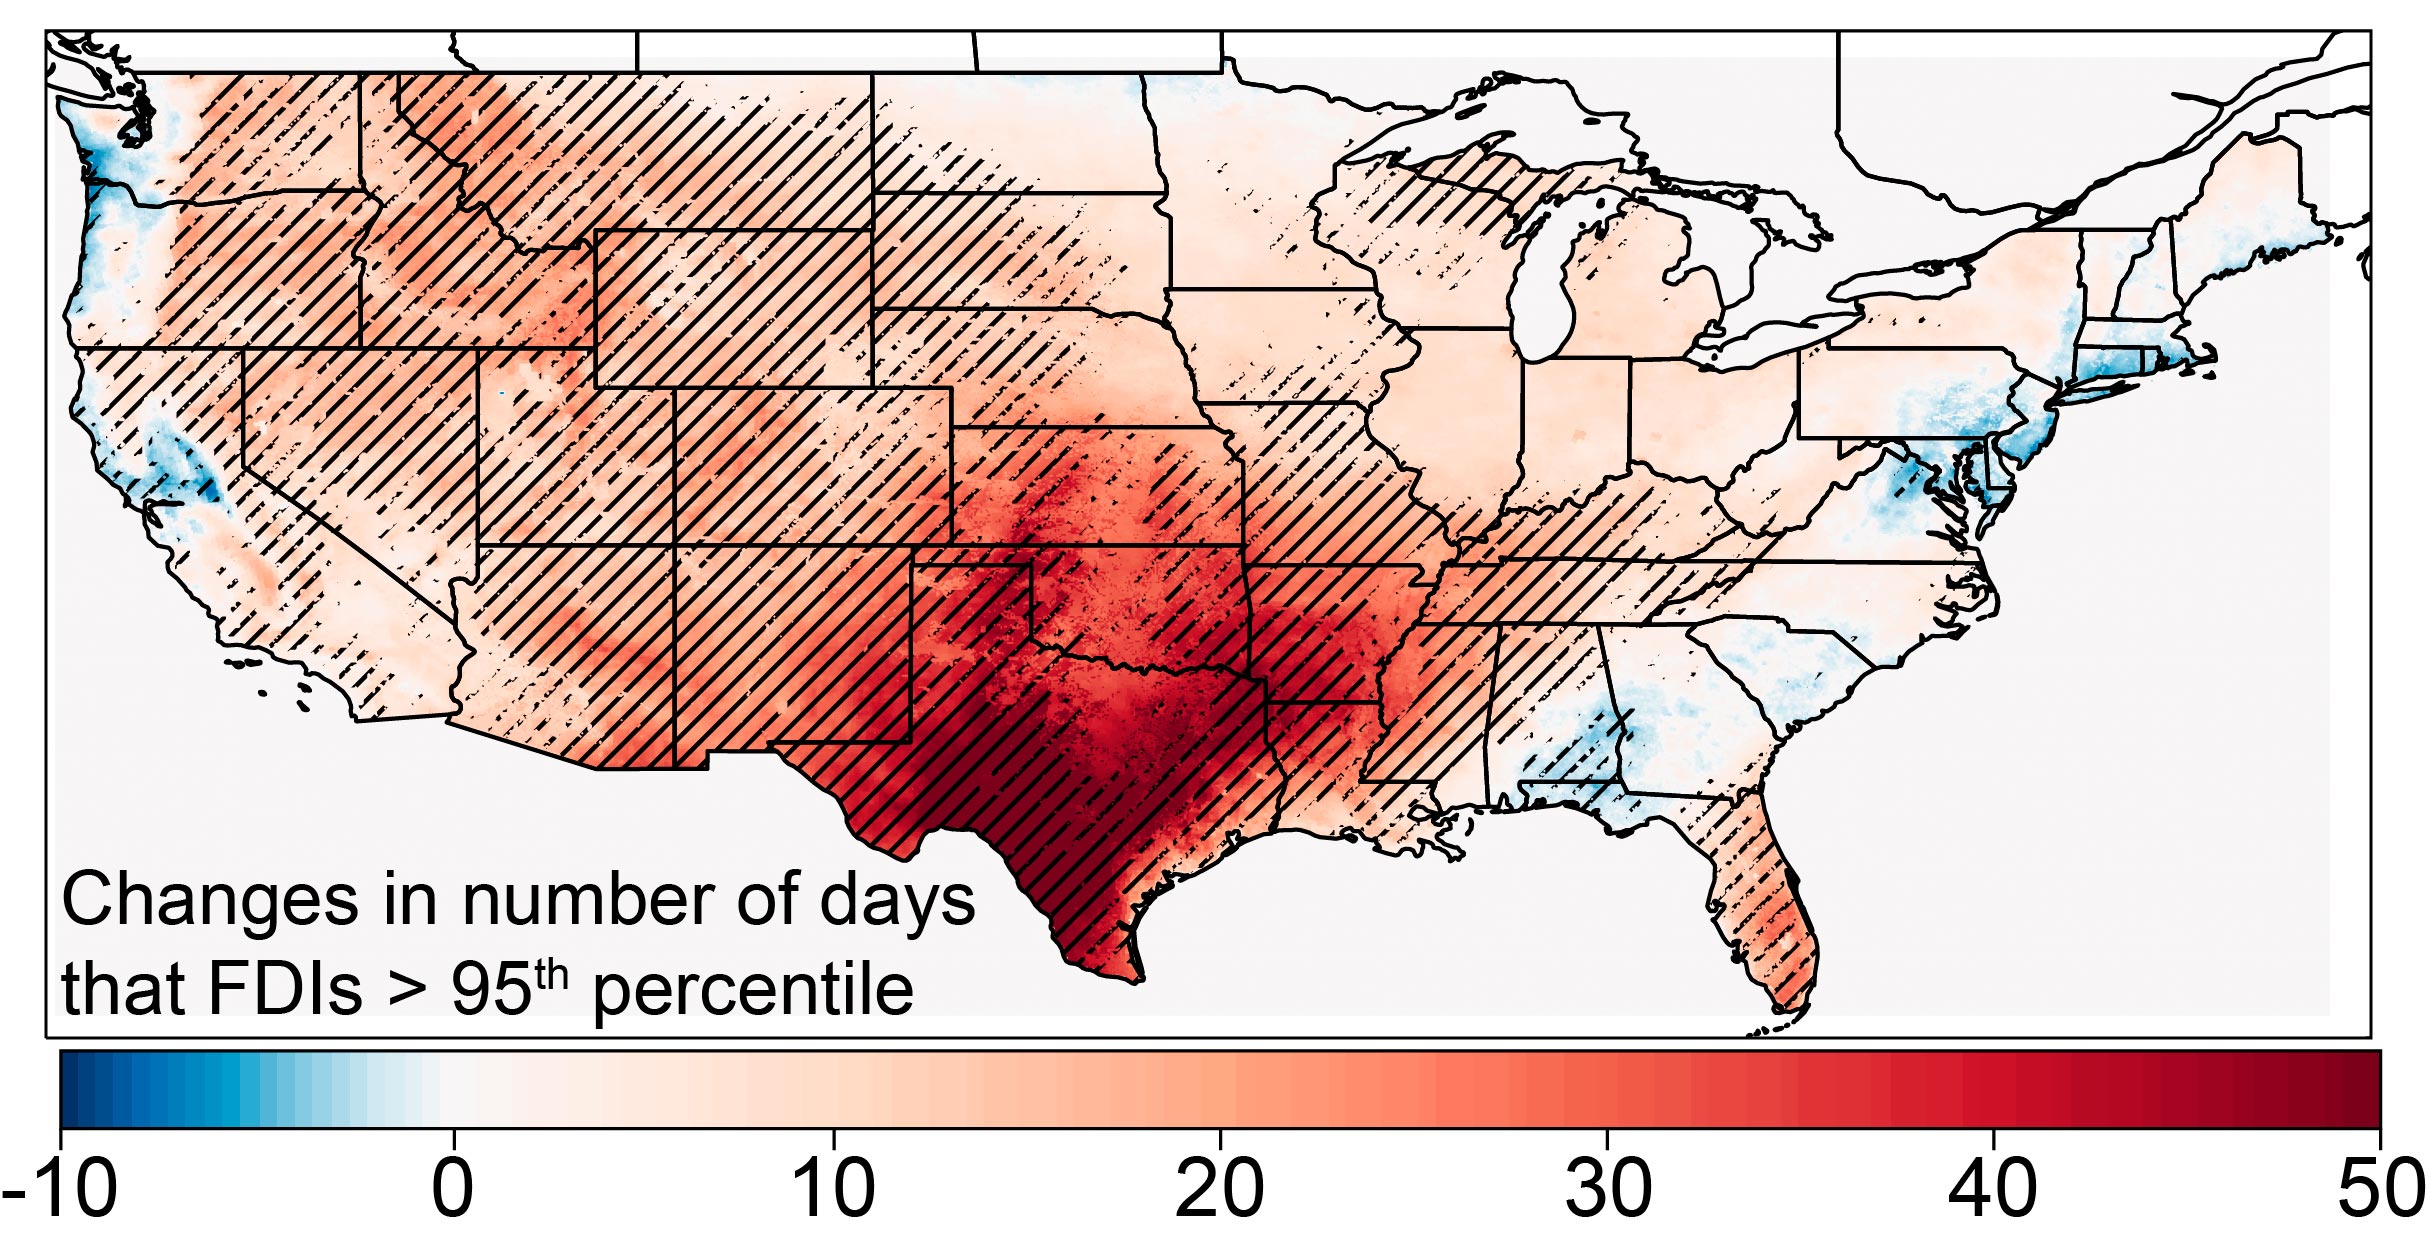
By plugging the fire danger indices into future climate projections, the study found that extreme wildfire risk will increase by an average of 10 days across the continental U.S. by the end of the century, driven largely by increased temperatures. Certain regions, like the southern Great Plains (including Kansas, Oklahoma, Arkansas, and Texas) are projected to have more than 40 additional days per year of extreme wildfire danger. A few small regions are projected to see a decrease in their annual wildfire risk season due to higher rainfall and humidity, including the Pacific Northwest coast and the mid-Atlantic coast.
Regional Variations and Seasonal Shifts
In the Southwest, the extreme wildfire season is projected to increase by more than 20 days per year, most of which will occur in the spring and summer months. Longer fire seasons extending into the winter months are also projected, particularly for the Texas-Louisiana coastal plain.
“Under a warmer future climate, we can see that the fire danger will even be higher in the winter,” Yu said. “This surprised me, because it feels counterintuitive, but climate change will alter the landscape in so many ways.”
Implications for Fire Management
The study authors hope that the study will help fire managers understand the size of potential wildfires so they can prepare accordingly, as well as understand how fire seasonality will shift and extend under a changing climate.
Reference: “Performance of Fire Danger Indices and Their Utility in Predicting Future Wildfire Danger Over the Conterminous United States” by Guo Yu, Yan Feng, Jiali Wang and Daniel B. Wright, 20 November 2023, Earth’s Future.
DOI: 10.1029/2023EF003823
Never miss a breakthrough: Join the SciTechDaily newsletter.
Follow us on Google and Google News.
2 Comments
I present this actual data from other planets and a way to possibly verify whether this is an additional cause of global warming. This could easily and cheaply proven with telescopes from earth as were used to collect some of the original atmospheric tsunami on Venus data. It could also prove the existence of dark matter in the solar system and if not physicists would need to come up with a better explanation for what is happening throughout the solar system. If an annual planetary alignment can result in a 20 degree spike in temperature at the poles of our planet 2 months later, then evaporating a significant amount of dark matter near L1 should be seen in weeks. Although if you generate enough heat you would pretty much prove the concept right then and there.
Dark matter phase transitions could be a primary climate driver. If the solar system passes through an area of higher liquid dark matter content the planets cores would all receive more heat due to increased phase transitions thus heating the earth from the inside out.
Heating of the planet from the inside out would result in :
Increased ground temperatures
Increased sea temperatures
Increased nighttime temperatures
Increased seismic activity
Increased earthquakes
We are currently passing through the S1 dark Matter stream
Dec 12 2016 Venus Mercury alignment tsunami rotation slowed
Dec1 2018 Venus Mercury alignment tsunami rotation slowed
June 3 18:00 2020 +0 29 North Venus Earth conjunction VENUS TSUNAMI facing the Earth day 1
July 2020 Siberian heatwave and Antarctica temperature spike
Jan 9 01:00 2022 +4 51 North Venus Earth conjunction VENUS TSUNAMI facing the Earth and the planets were slightly closer than the last conjunction 585 days
March 18 2022 Concordia Station spiked 39 C degrees due to unusual air patterns near Australia
North Pole regions hit 30C above normal
Aug 13 11:00 2023 -7 41 south Venus Earth conjunction VENUS TSUNAMI was past the outward deflection and on its way back 1166 days also Venus was south of the orbital plane
Oct 28 2023 I predicted a major heat release in the Arctic and Antarctic due to combined tidal affects on the dark matter sphere around the sun in combination with the movement of the barycentre of the Earths location. VENUS TSUNAMI was facing the side and the distance between the planets was further and there was no online data from Concordia.
DATES TO WATCH for tsunami rotation ?? Pre and post rotation rates are needed
Jan 16-25. 2024 Mercury Venus alignment
Mar 07-20 2024 Mercury Jupiter alignment Venus Mars alignment
Apr 11-18 2024 Mercury Earth alignment Jupiter Uranus alignment
May 20-28 Venus Jupiter Uranus alignment Mercury Mars Saturn ? Neptune ?
June 15-23 Mercury Venus alignment
Venus atmospheric temperatures from 2009-2017 also were higher after conjunctions
Venus atmospheric rotation takes 4 days – atmospheric tsunami takes on average 5 (4.9?) days to circle Venus since 1986 this could be caused by an offset dark mater sphere as a result of wobble induced by overflow of LDM every 5 days when the sphere is closest to the sun. This departing kick is what keeps the offset between Venus and its dark matter sphere which then accumulates LDM for 5 more days. The interval from the data I found varies from 4-6 days the 6 day stretch was after the 2022 conjunction which may have depleted its dark matter reserves resulting in a slower tsunami rotation. The clouds at that level take 5.7 days to circle the planet (tsunami speed = 328 kph)
The earths core also has an 8.47 day astronomically induced wobble.(LDM sphere)
NASA issued a climate change warning for Mars after Mariner 9 (icecaps melting)
Neptune has been heating up since 2018
It appears that an important negative feedback loop has been overlooked, particularly for arboreal forest wildfires. There isn’t an unlimited, constant amount of fuel. When wildfires burn, the total amount of fuel is reduced, and natural firebreaks are created. Thus, the likelihood of massive fires is reduced for several years.