In 2024, NASA-sponsored researchers embarked on the Arctic Radiation-Cloud-Aerosol-Surface Interaction Experiment (ARCSIX) in Greenland to explore the rapid decline of Arctic sea ice.
Utilizing three NASA aircraft for detailed atmospheric and oceanic measurements, the team investigated the impact of clouds, aerosols, and radiant energy on ice melt. Findings aim to refine climate models by capturing real-time data on cloud properties and sea ice dynamics.
Arctic Ice Dynamics and Research Initiatives
The sea ice covering the Arctic Ocean reaches its thickest point during the long, dark winter months. As spring arrives, bringing sunlight and warmer temperatures, the ice begins to thin and break apart. Winds and currents push ice floes southward through narrow passages on both the eastern and western sides of Greenland.
For decades, scientists have used satellite data to monitor the ice from spring to fall, tracking its extent and concentration as it melts. In 2024, as usual, this tracking continued, but a team of NASA-sponsored researchers also had the rare chance to travel to northern Greenland to study lesser-known aspects of the melting process up close.
Field Campaign in Greenland: ARCSIX
As part of the field campaign, called the Arctic Radiation-Cloud-Aerosol-Surface Interaction Experiment (ARCSIX), three NASA aircraft—the low-flying P-3 Orion and the high-flying Gulfstream III and Learjet 35—deployed for three weeks in May and June and again for a month in July and August. Scientists from several institutions, including the University of Colorado Boulder, the University of Michigan, Washington University in St. Louis, the University of Arizona, and Colorado State University, participated.
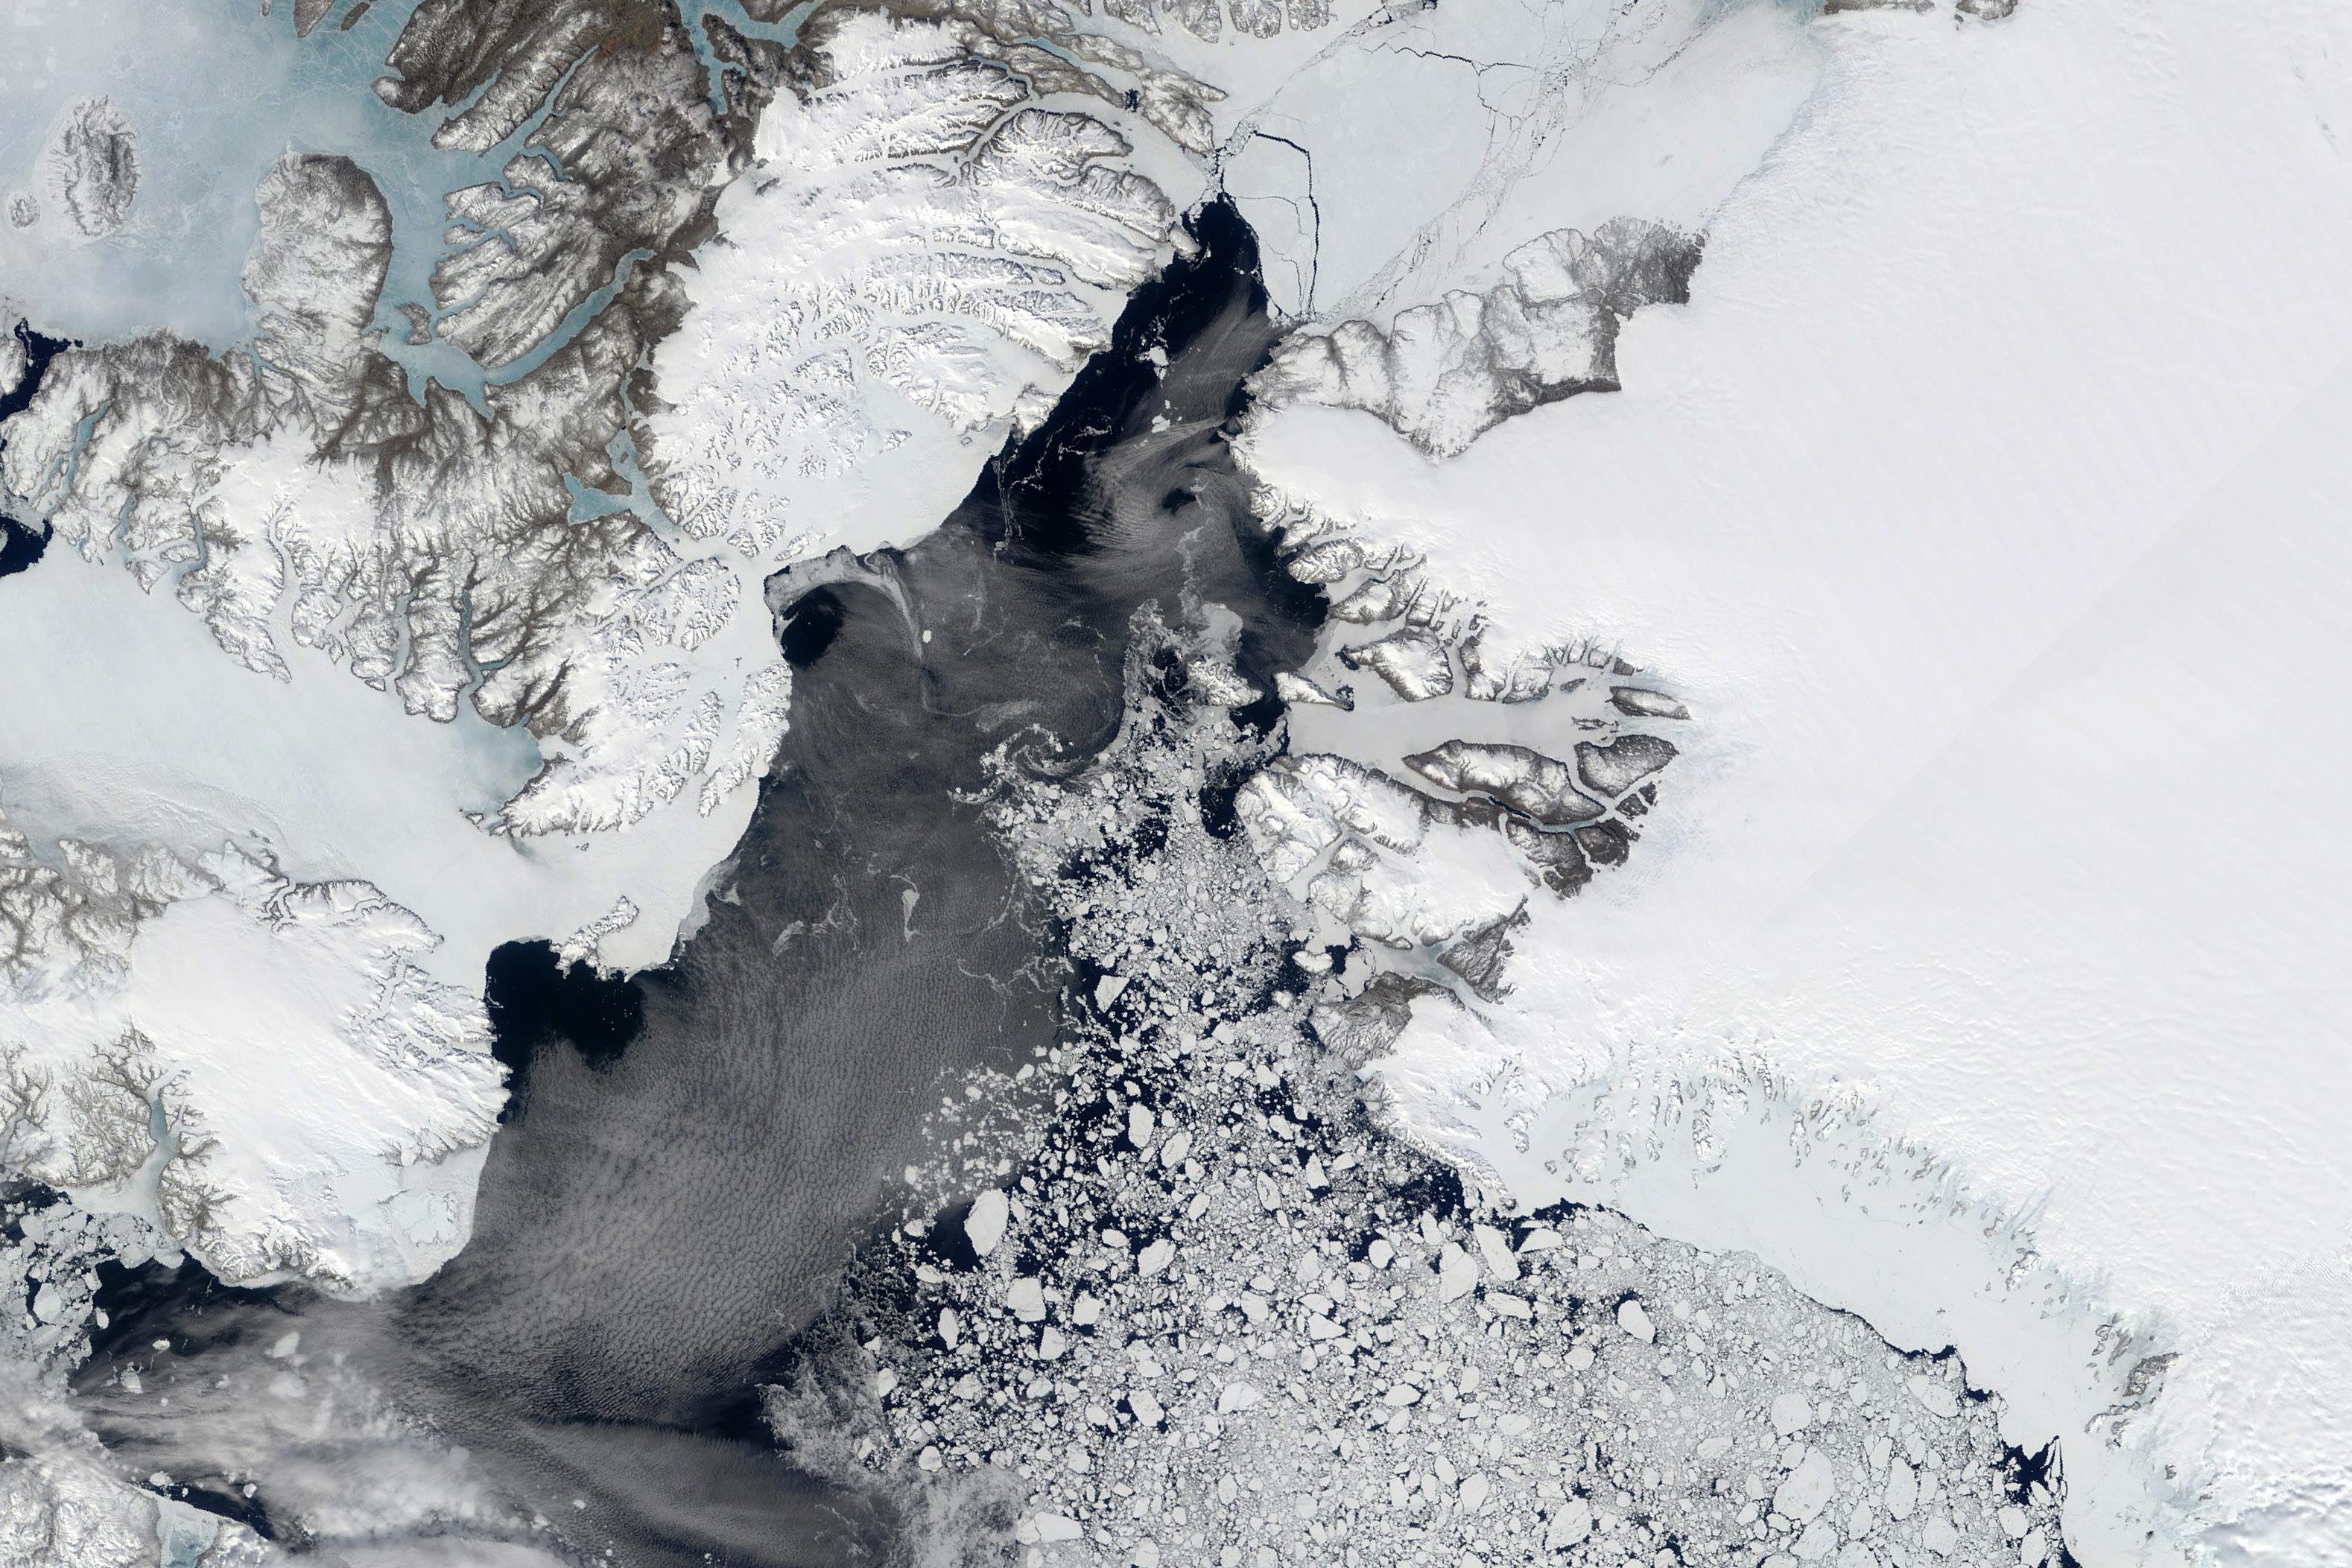
The image at the top of the page, acquired by the MODIS (Moderate Resolution Imaging Spectroradiometer) on NASA’s Terra satellite on June 15, 2024, shows Pituffik Space Base, where the 70-person team was based. Flights typically went north through Baffin Bay and the Nares Strait along Greenland’s west coast. Next, they flew either west to the vicinity of Ellesmere Island or east along Greenland’s north coast as far as Station Nord or the Fram Strait. The Fram Strait, on the eastern side of Greenland, is the largest outlet for sea ice from the Arctic Ocean, accounting for about 90 percent of the total sea ice exported from the basin each summer.
Climate Change and Arctic Challenges
“Our objective was to measure the evolution of Arctic sea ice over the summer melt season in one of the world’s last remaining bastions of multiyear sea ice,” said Patrick Taylor, the ARCSIX deputy mission science lead. “We went to Greenland to measure the properties of the atmosphere and the ocean to better understand what is driving the rapid retreat of Arctic sea ice that we’ve seen in recent decades.”
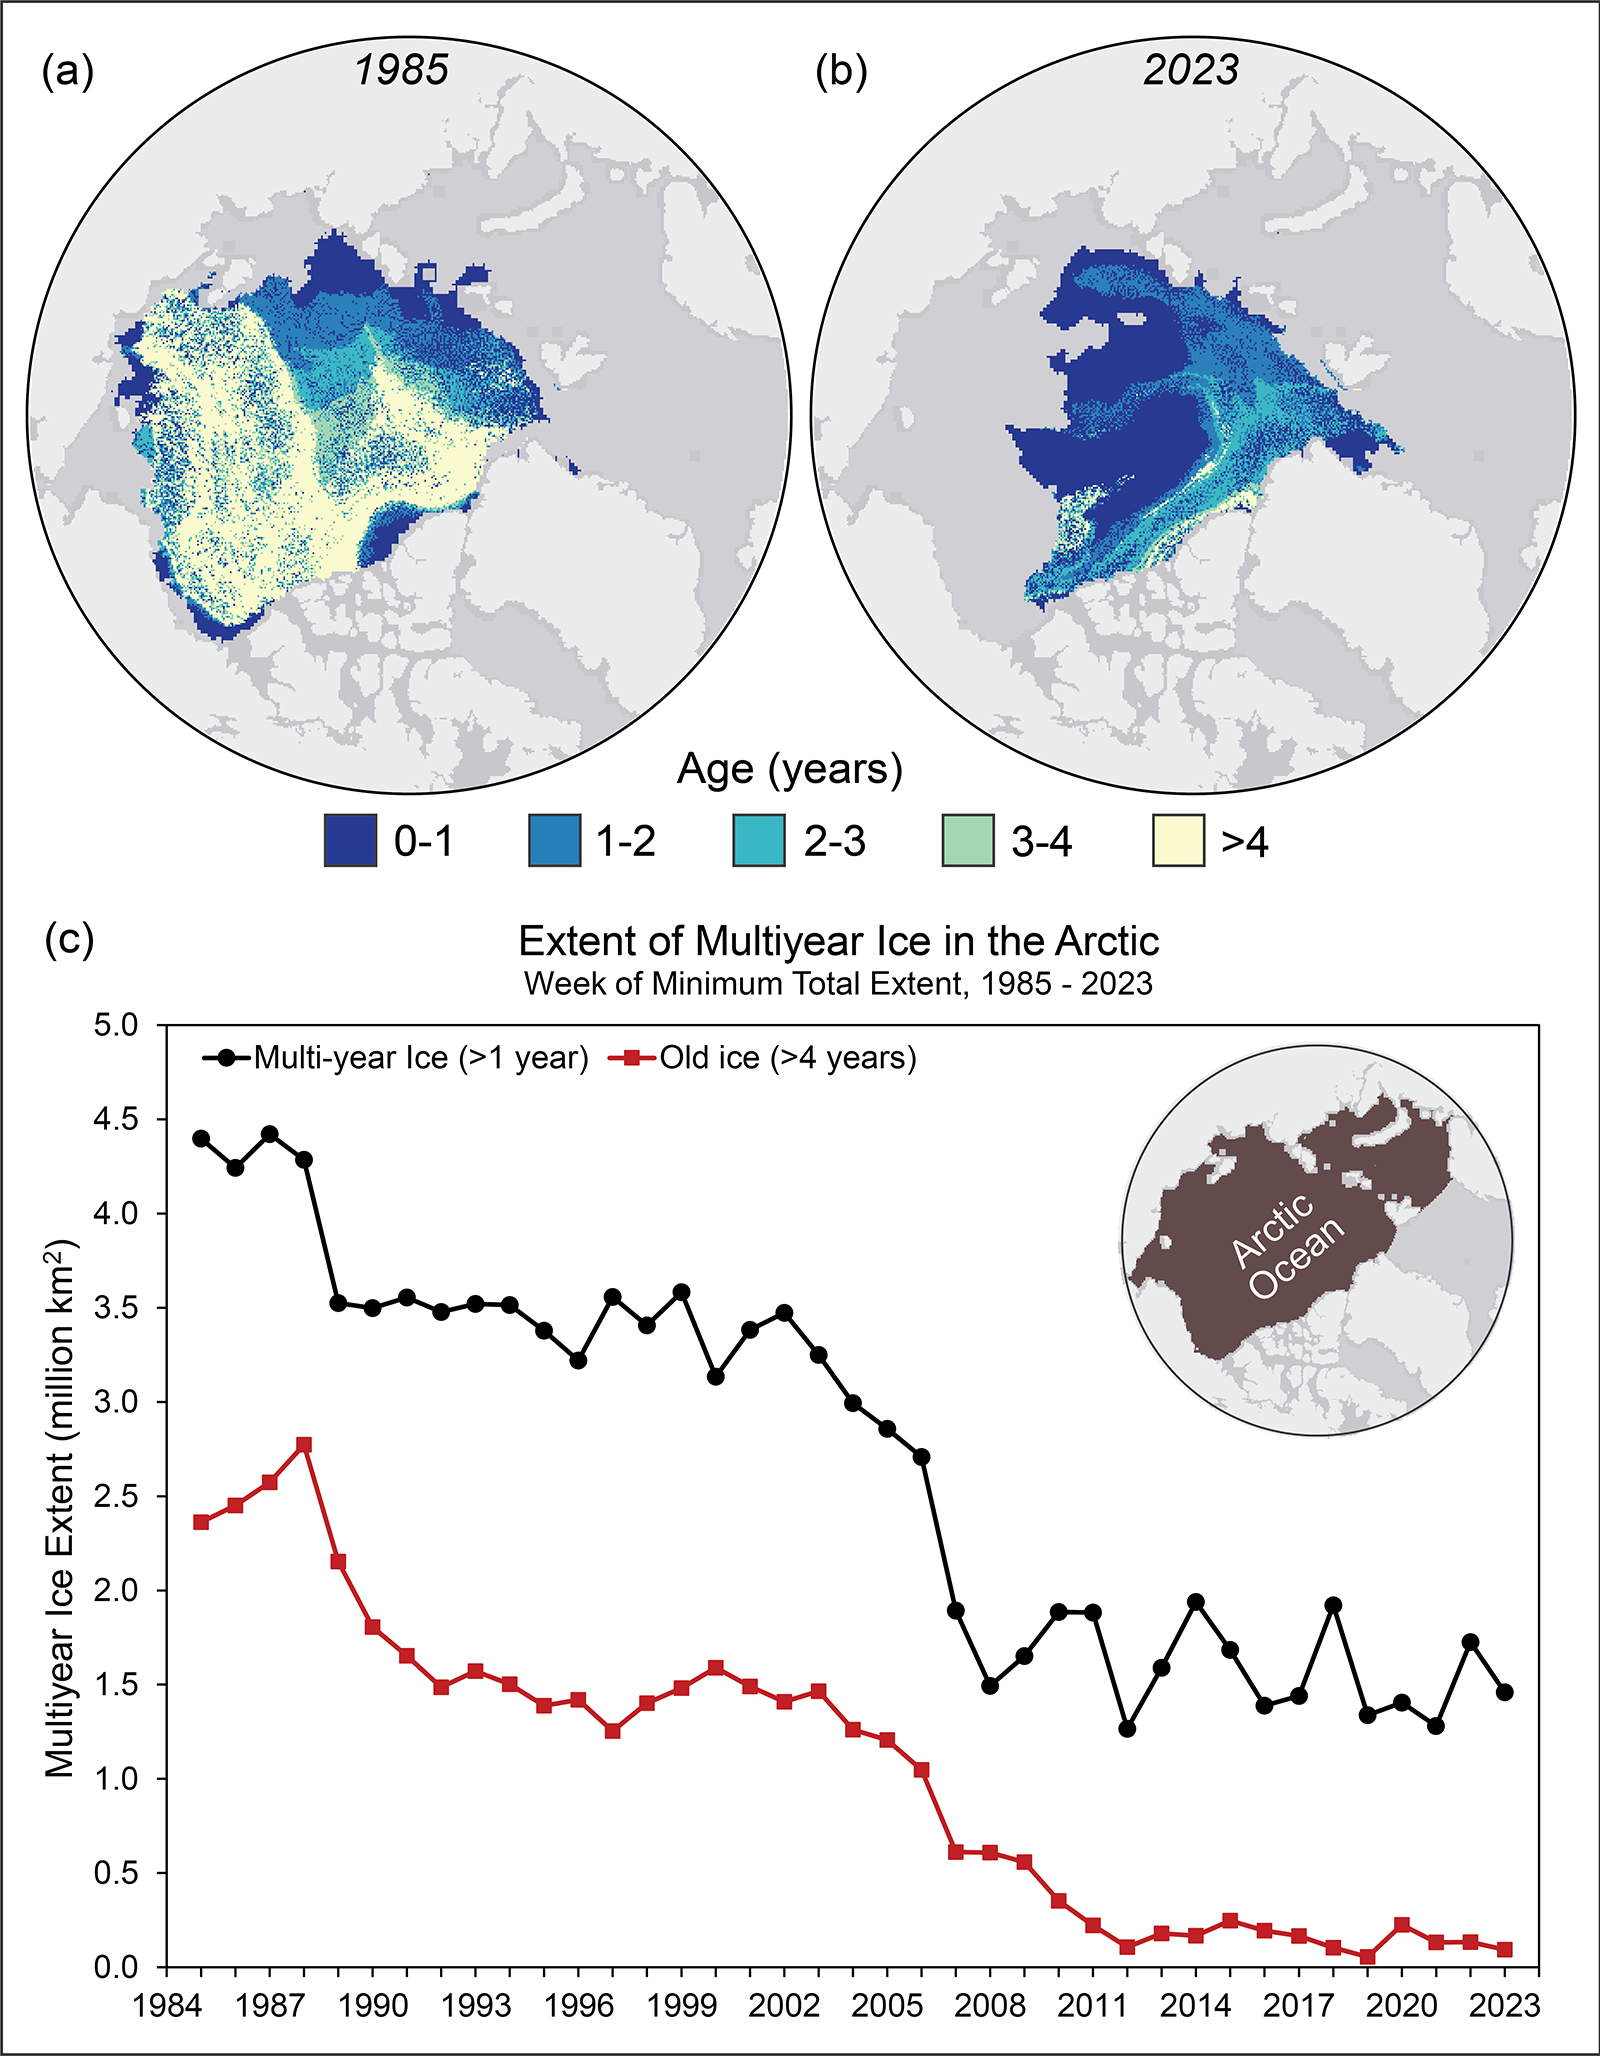
The minimum extent of Arctic sea ice has declined by about 12 percent per decade, dropping from 7.54 million square kilometers in September 1980 to 4.37 million square kilometers in September 2023. Most of the Arctic’s sea ice was thick, multiyear ice in 1985, compared to just a small fraction now. Temperatures in the Arctic have risen at least twice as fast—and possibly nearly four times faster—compared to the average for the rest of the world, a phenomenon known as “Arctic amplification.”

Aerosol Effects and Cloud Studies
One of the main science goals of the ARCSIX team was to study how the presence of certain types of clouds that are not easily characterized by satellites might influence the rate of melting. “Clouds can either warm or cool the ice surface depending on cloud thickness, elevation, and cloud-particle properties,” explained Ralph Kahn, a member of the ARCSIX team and emeritus research scientist at NASA’s Goddard Space Flight Center (GSFC) now at the Laboratory for Atmospheric and Space Physics at University of Colorado Boulder. “And key cloud properties are affected by airborne particles called aerosols, that arrive as dust or smoke plumes, ocean spray, and other sources to seed clouds and sometimes alter their extent and properties.”
Kahn’s main role during the spring deployment, supported remotely by GSFC scientists Peter Colarco and Lauren Zamora, was to deliver a daily aerosol forecast and briefing to the team, summarizing the distribution, types, and amounts of particles expected during a potential flight the next day. The midmorning briefings were based on a combination of satellite and ground-station measurements and the output from several models, including the GEOS (Goddard Earth Observing System) model developed by NASA.
Data Collection and Preliminary Findings
The ARCSIX team collected reams of data about the changing properties of the sea ice, as well as clouds, aerosols, and the radiant energy balance that will be scrutinized by scientists in the coming months and years. “ARCSIX has been unbelievably successful,” Taylor said. “We were able to capture data in all the different sea ice and cloud conditions that we had hoped for. It was also remarkable just how many different types of aerosol layers we observed in the Arctic. We sampled smoke, dust, marine aerosols, air pollution, and even particles from a volcanic eruption.”

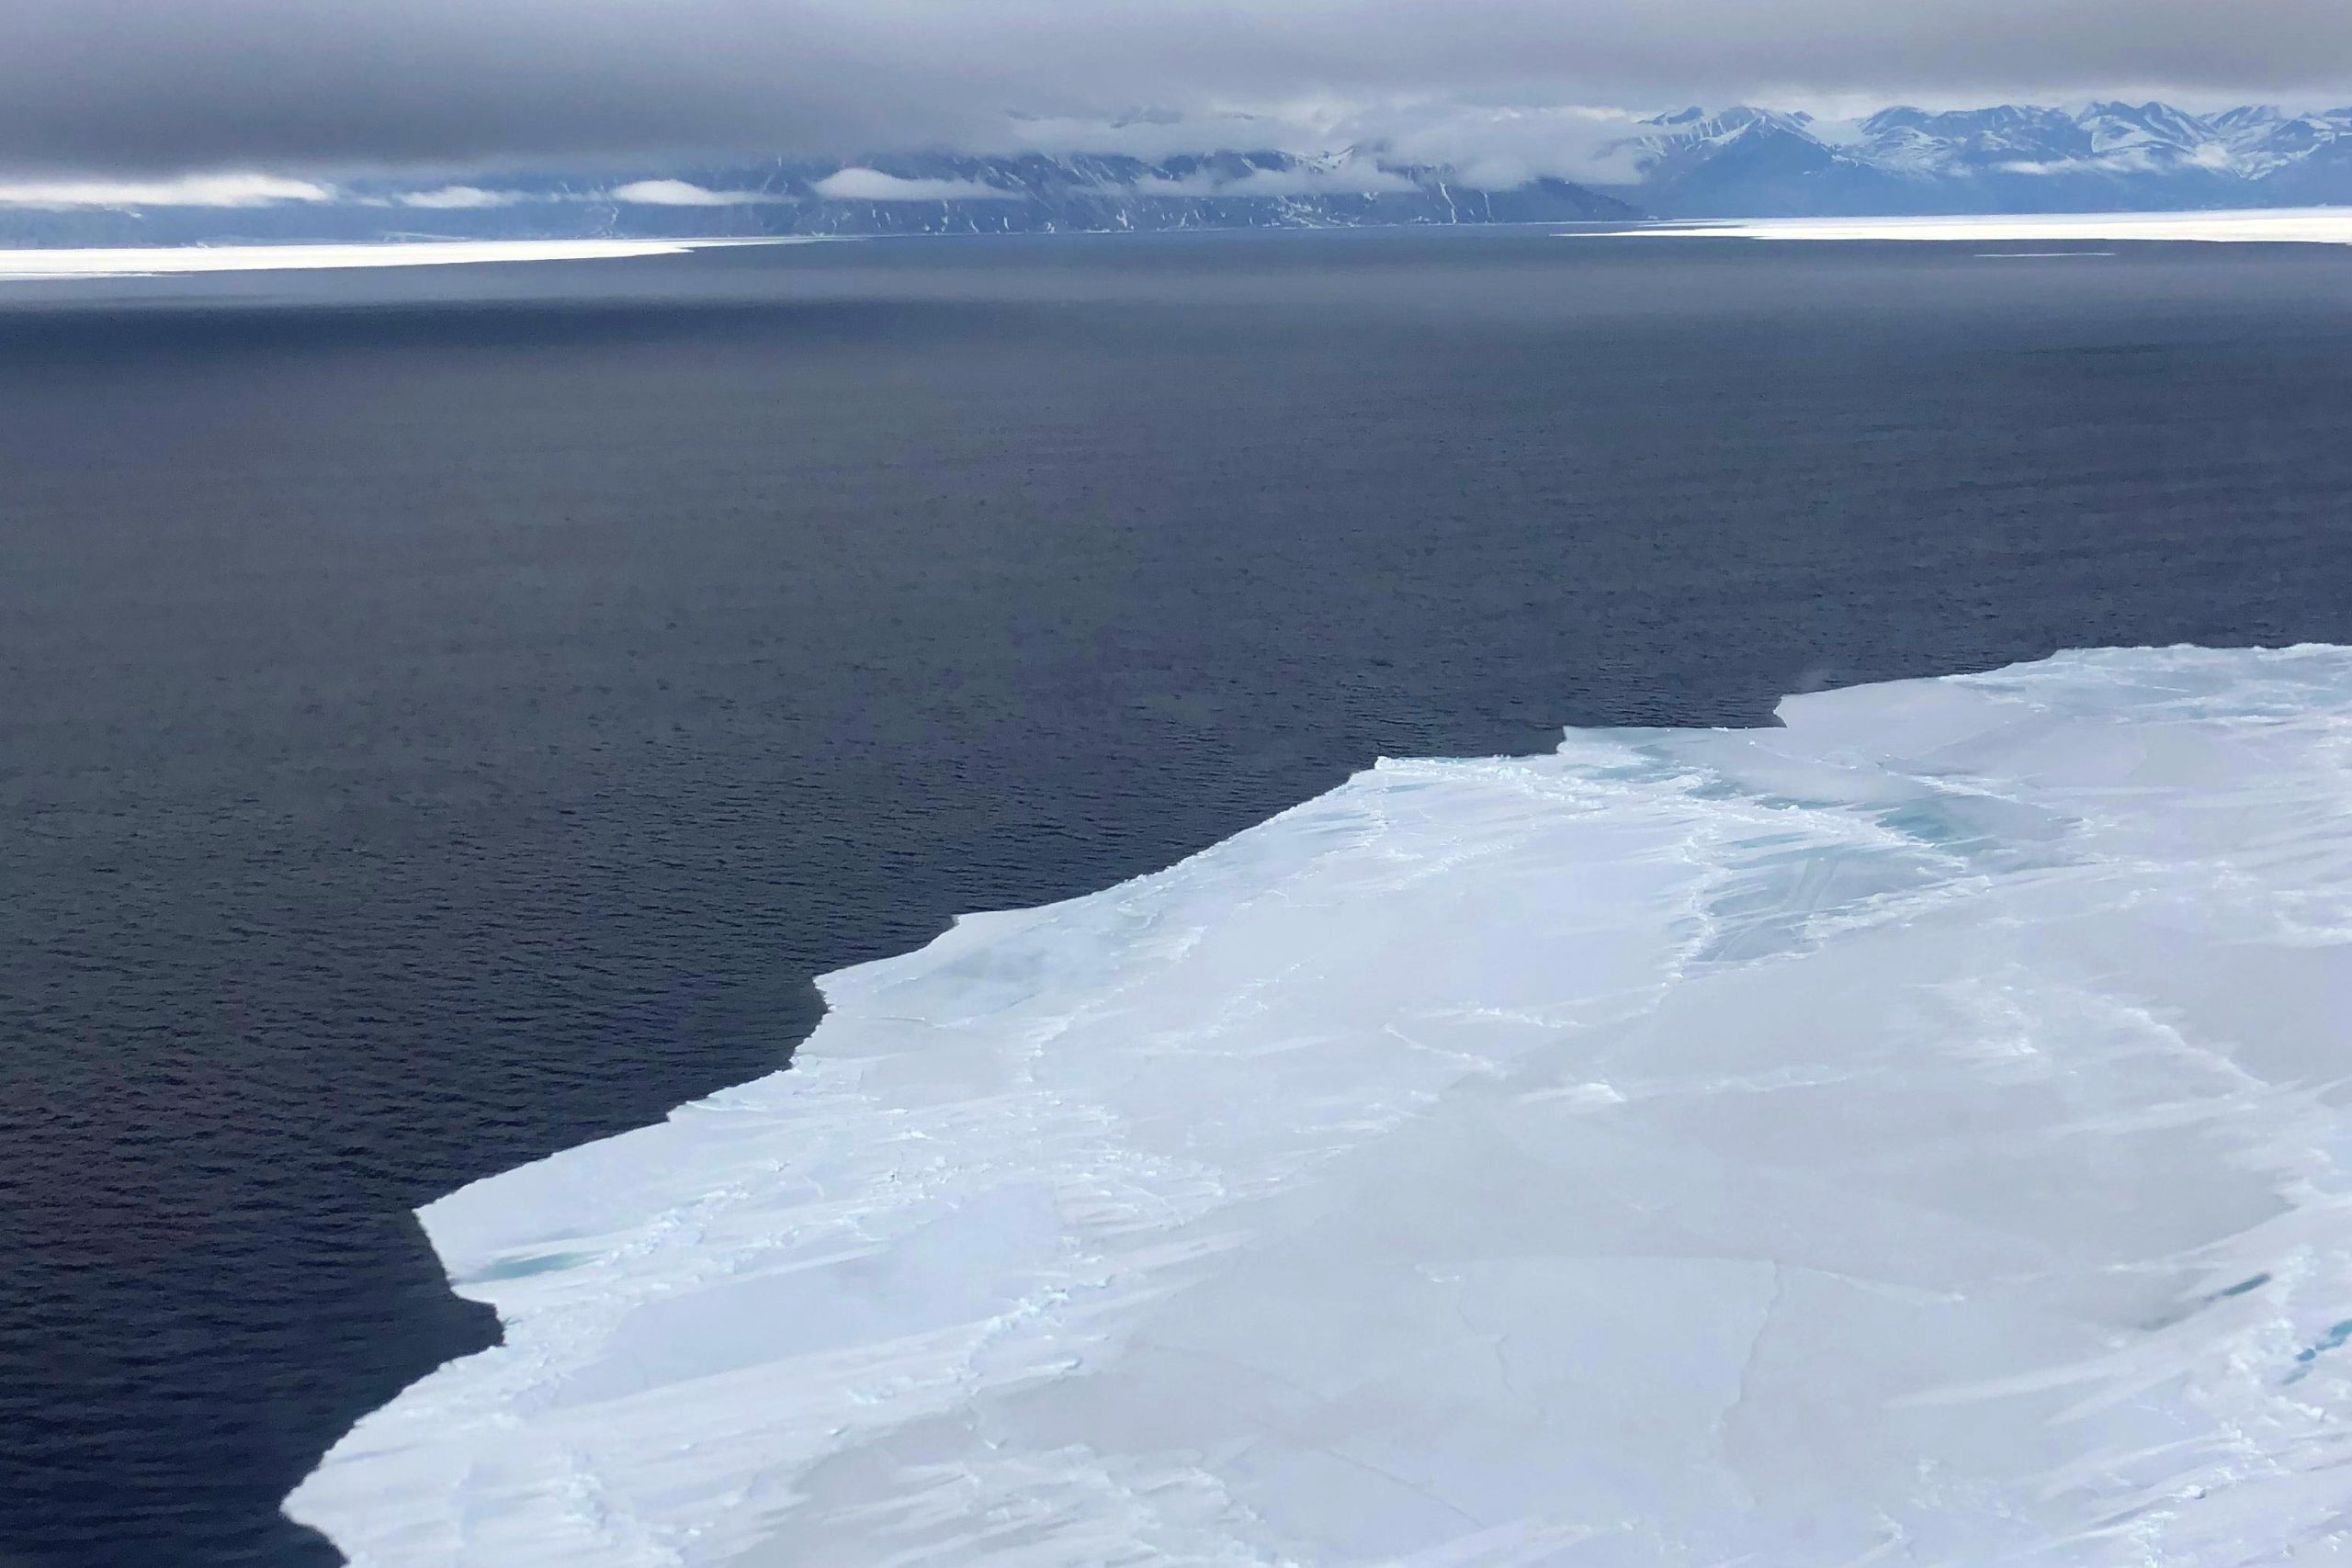
Kahn also returned with a stash of photos of life on the base and from a June 11 flight on the P-3 that offered glimpses of sea ice, ice sheets, and glaciers in this remote and fast-changing region. The images above showcase sea ice’s bright, reflective surface (high albedo, right image) that keeps the surface cooler in contrast to the dark, absorbing nature of open water (low albedo, left image). The darker open water absorbs significantly more solar energy than bright ice-covered areas and warms up even more rapidly over time—an example of a feedback cycle that amplifies the rate of warming and ice loss in the Arctic. (This Notes from the Field blog post shows more photos of what life was like on the ground in Greenland, including several taken by Kahn.)
Reflections and Future Research Directions
“Why am I here in Greenland? Why do we do these field campaigns?” Kahn wrote in an email while deployed to Greenland. “We already know that the Arctic will get warmer in the future. But how rapidly? And will it be windier? Drier? Cloudier? Models produce ‘results,’ but are the assumptions they make sufficiently accurate?” he said. “Questions like these are hard to answer, but if we can add a small piece of reality to the picture by taking measurements in the field, it justifies all the effort.”
Among the most important data that the scientists collected in Greenland were detailed measurements of low, thin clouds, such as those seen in the video clip above, that can be challenging to identify and interpret with satellite imagery alone. “We’ve gotten a really good look at these clouds for the first time, and it’s possible they may have a much stronger influence on Arctic surfaces and sea ice cover than we realized,” Taylor said. “I can’t wait to dig into the data to try to understand their role better.”
NASA Earth Observatory image by Wanmei Liang, using MODIS data from NASA EOSDIS LANCE and GIBS/Worldview. Photographs and video by Gary Banziger (NASA Langley) and Ralph Kahn(NASA GSFC/University of Colorado Boulder).
Never miss a breakthrough: Join the SciTechDaily newsletter.
Follow us on Google and Google News.
4 Comments
“The minimum extent of Arctic sea ice has declined by about 12 percent per decade, dropping from 7.54 million square kilometers in September 1980 to 4.37 million square kilometers in September 2023.”
It should be noted that the minimum was reached in 2012, and the extent has been growing since then. By October 2024 the sea ice extent was back within the +/- 2 sigma region, meaning that about 95% of all measurements include the recent measurements.
See https://scitechdaily.com/polar-ice-crisis-2024-arctic-and-antarctic-near-historic-lows/
“The images above showcase sea ice’s bright, reflective surface (high albedo, right image) that keeps the surface cooler in contrast to the dark, absorbing nature of open water (low albedo, left image).”
Snow-covered sea ice reflects diffusely. That basically means that the impinging light is reflected randomly in all directions, meaning that it looks pretty much the same (bright) from all viewing positions.
On the other hand, the open water reflects specularly, like a mirror. That means that to see the light reflected off the water, one has to be in a special position, looking towards the sun at an elevation such that the viewing angle is the same as the angle of incidence of incoming light rays. When viewed in that special position and direction, the reflected light is blinding because ALL the forward reflected light is confined to a narrow sheaf of rays instead of being scattered in all directions. [Think about the last time you were driving into a setting sun after a Summer shower that made the pavement wet.] The water does not look black because there is glacial flour and plankton suspended in the water that reflects diffusely. Arctic water can actually have a total reflectance higher than snow (particularly old snow) if the sun is on the horizon. See the following:
https://wattsupwiththat.com/2016/09/12/why-albedo-is-the-wrong-measure-of-reflectivity-for-modeling-climate/
I actually hope that whoever wrote this press release is being disingenuous because it is a little scary to think that the people spending our tax money don’t actually understand optics very well. Even water in the tropics can have a reflectivity of 100% on the limbs, where the suns rays are glancing.
Is not the article basically discussing absorption of solar energy by water in comparison with the solar energy absorbed by ice? Sort of similar to the difference between black roofs and silver or white roofs? The black ones get hotter than the white ones even though the roof materials are the same: or black hose-pipes when compared with light-coloured hose-pipes of the same material and diametre and filled with water.
The answer to your question is, “No.” I take it that you did not read the link I provided. The author(s) are trying to make the comparison you suggest, but the comparison is invalid. Roof shingles and rubber hoses are typically diffuse reflectors. That means there is relatively little difference (to a first-order approximation) in the reflectivity, or apparent color, of them with changing sun angles. On the other hand, water changes significantly in its reflectivity, particularly for the high angles of incidence commonly found in polar regions.
Also, ice only has half the specific heat capacity of water, meaning that for equal masses, ice/snow will increase its temperature twice as much as water when exposed to the same radiant energy. Therefore, comparing roof shingles of different colors to ice and water is a very poor analogy.