In February 2025, an unrelenting high-pressure system sent temperatures soaring across South America.
Rio de Janeiro sizzled under extreme heat, forcing schools to delay opening and residents to seek relief at the beach. With temperatures breaking records—hitting a blistering 44°C (111°F) in some areas—the heatwave brought discomfort and concern. Neighboring Argentina also baked under the oppressive heat, with six provinces eventually placed under a red alert.
Intense Heatwave Grips South America
In February 2025, a high-pressure system settled over the southern Atlantic Ocean, driving temperatures to extreme levels across parts of South America. In Brazil, the intense heat forced officials in Rio Grande do Sul to delay the start of the school year, while residents of Rio de Janeiro sought relief at the beach.
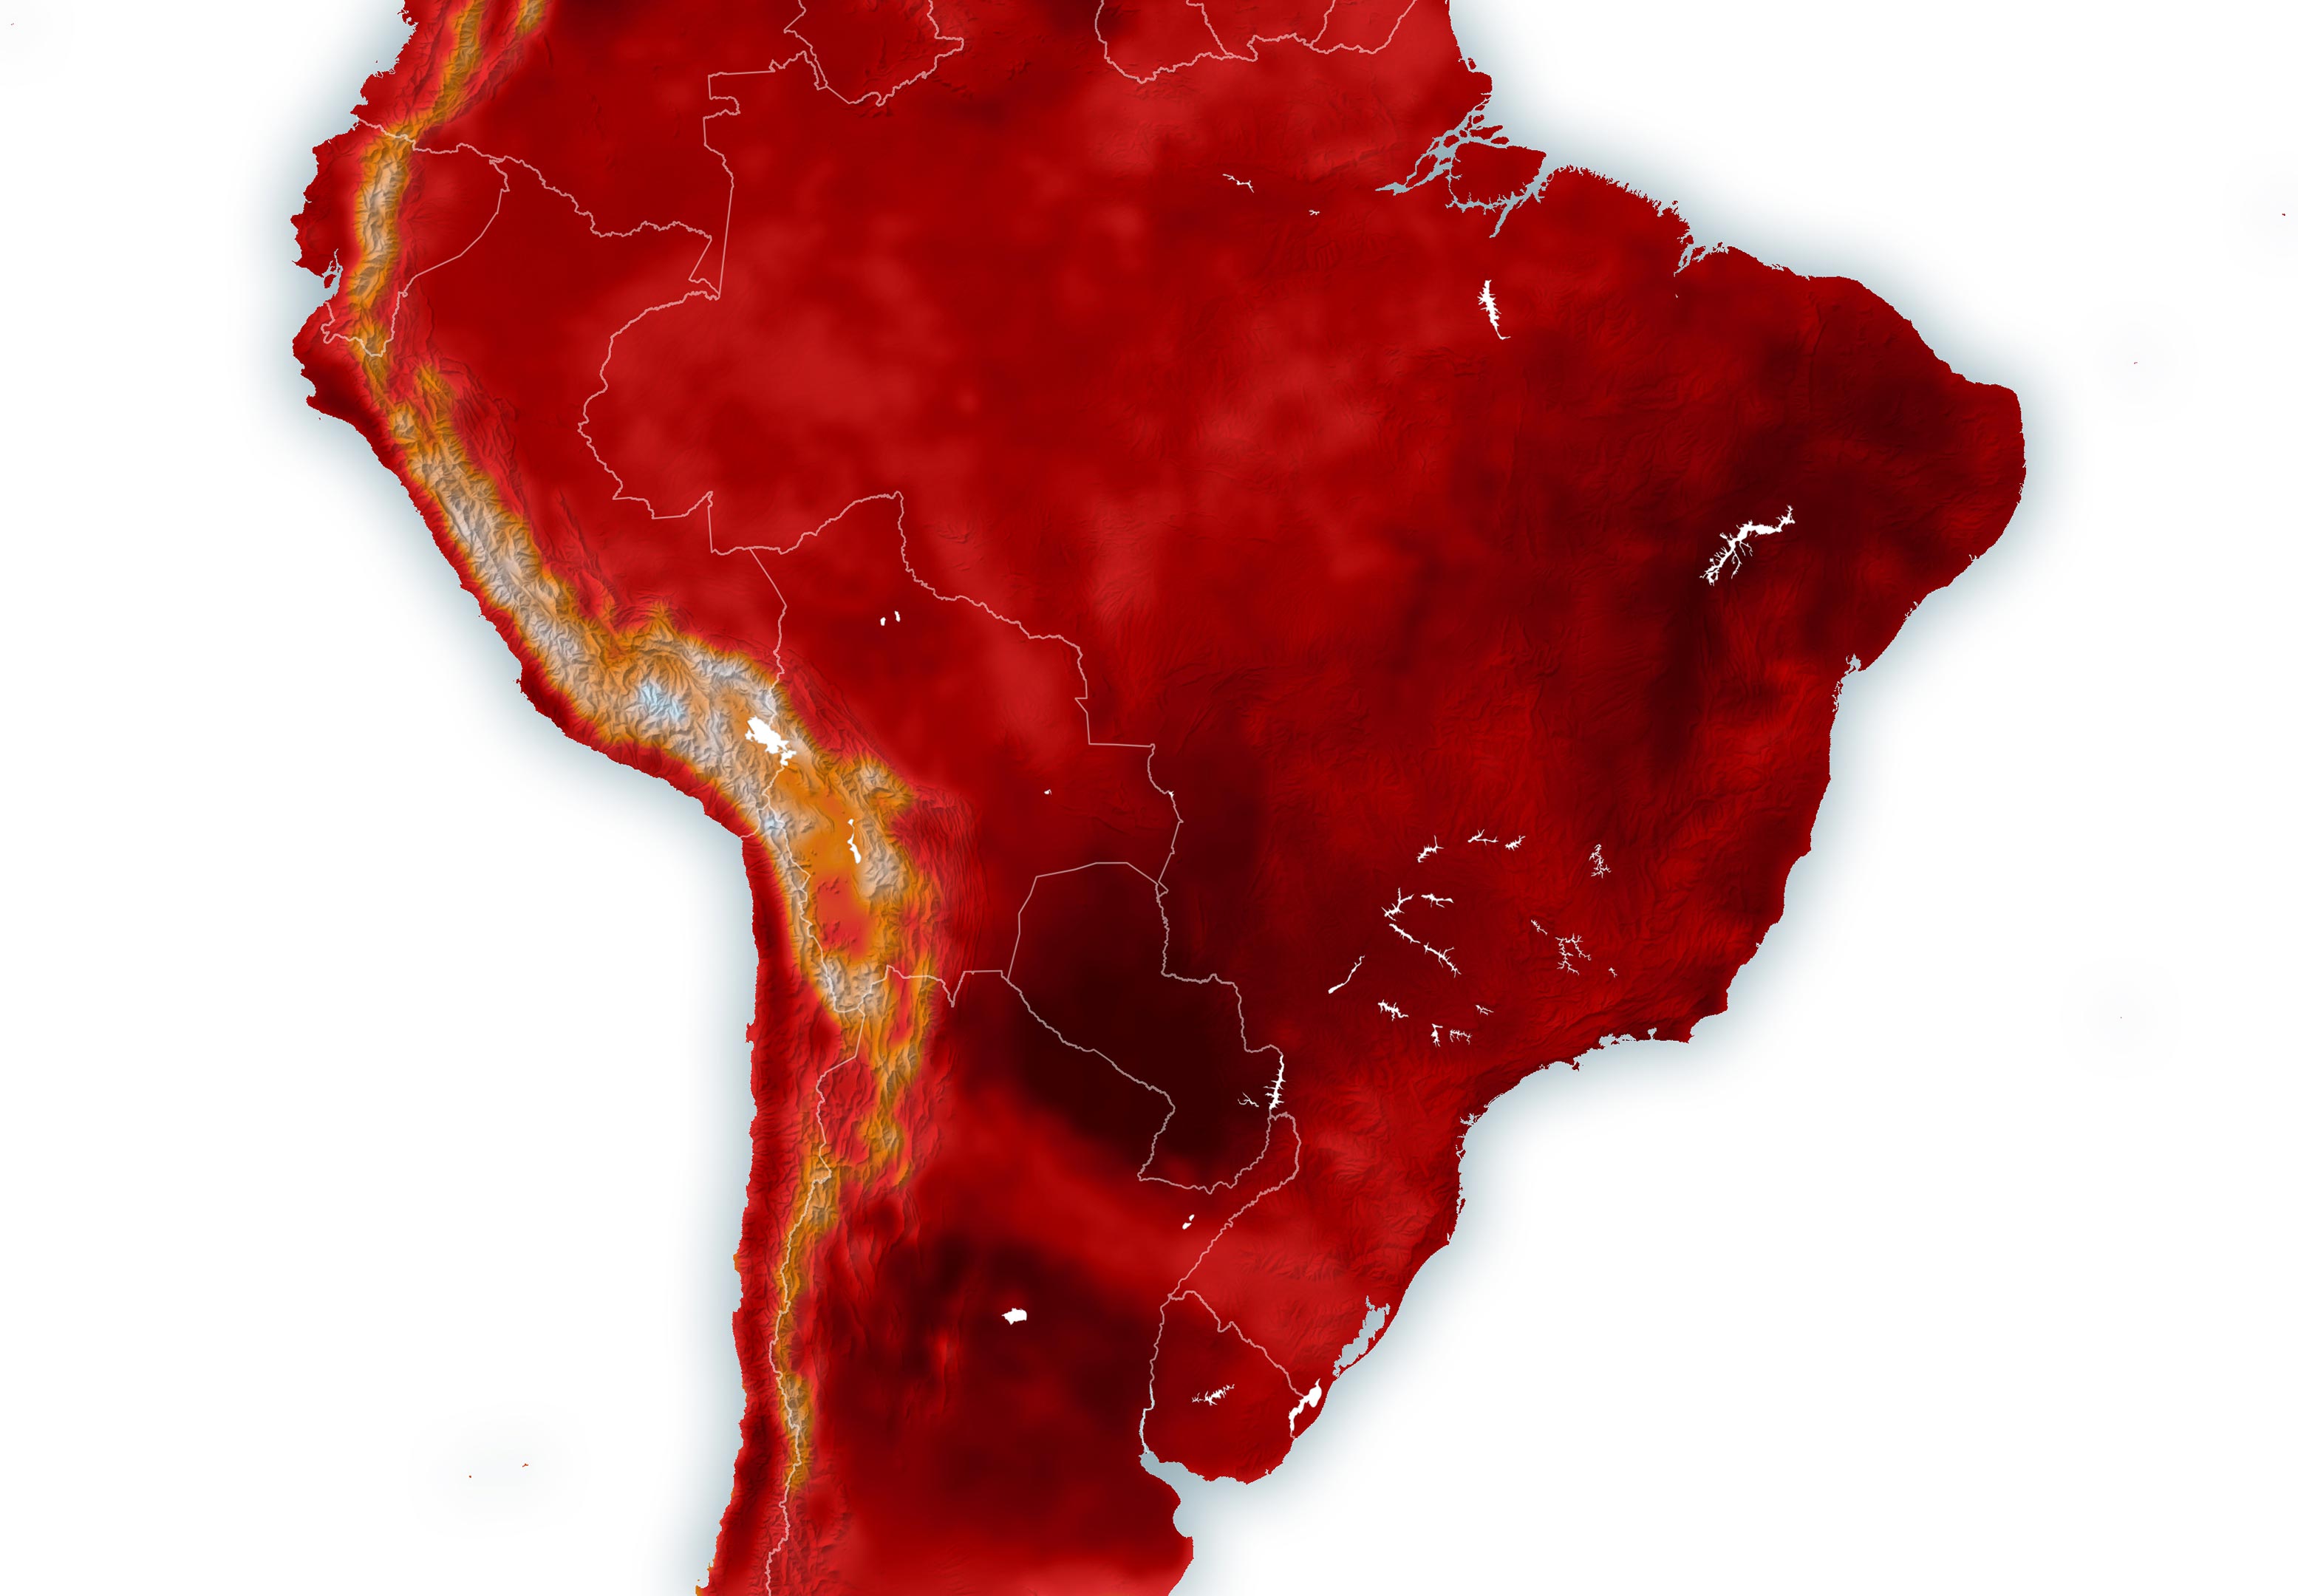
A heat map from February 17 (see image above) illustrates the severity of the heatwave, showing air temperatures measured at approximately 2 meters (6.5 feet) above the ground. This data was generated by combining satellite observations with forecasts from the GEOS (Goddard Earth Observing System) model, which simulates atmospheric processes using mathematical equations. The darkest red areas on the map highlight regions where temperatures reached or exceeded 38°C (100°F).
Rio de Janeiro Reaches Unprecedented Highs
Rio de Janeiro experienced particularly extreme heat that day. According to news reports, a weather station in the Guaratiba neighborhood recorded a high of 44°C (111°F) — the hottest temperature ever recorded since the city implemented its climate alert system a decade ago.
Brazil’s National Institute of Meteorology (INMET) noted several other municipalities across the state of Rio de Janeiro where temperatures exceeded 40°C (104°F) on February 17, such as Silva Jardim, which hit 42°C (108°F). The region’s heat wave continued through the week before returning closer to normal as the focus of the heat shifted south into Argentina.
Heatwave Expands into Argentina
Heat was already evident in northern Argentina on February 17, when the country’s National Weather Service (SMN-Arg) reported highs reaching up to 40°C. As of February 27, SMN-Arg noted that six provinces were under a red-level (very dangerous) alert for extreme heat.
NASA Earth Observatory image by Michala Garrison, using GEOS-5 data from the Global Modeling and Assimilation Office.
Never miss a breakthrough: Join the SciTechDaily newsletter.
Follow us on Google and Google News.
4 Comments
Why is 19 °C (66 °F) shown as an orange-red color? 19 °C is a little on the cool side of comfortable unless one is doing heavy manual labor, even more so if there is even a light breeze. I would say that a temperature about 22 °C (even redder) is optimal, albeit those accustomed to higher temperatures might prefer something a little warmer.
The color scheme chosen biases the subjective interpretation because the hue is the same for optimal temperatures as it is for actual hot temperatures and it is impossible to discern where the temperature really becomes oppressive. The color scheme is a poor choice and I would expect better from NASA — unless the choice was intended to make the situation appear worse than what it actually was. What is the probability that an entire continent, crossed by the equator, experiences a red-warning for everywhere except the the spine of the Andes, where breathing becomes difficult for people not acclimated to the elevation?
Speaking of “oppressive,” to properly convey the subjective impression humans experience, the Heat Index should be used, not just temperature. Heat Index tables typically use a color scheme that is more useful for determining discomfort and risk of hyperthermia. Wind and humidity both impact the subjective impression and therefore those factors should be incorporated. In the Andes, where it actually got cold (zero!), there were many places that the presence of wind could have been a risk for hypothermia, especially at night.
38°C or more is a common summertime temperature throughout much of the interior of California.
I’m left with the impression that the illustration was intended as agenda-driven propaganda rather than scientific information.
Or more basically your biased map sucks
Due to the climate change now the total world is facing various kinds of the vast level impacts. Extreme level temperature is now existing in the major portions of the global areas. In coming days the world wide eviction ratio of the temperature is going to increase above and above. To control the climate change relating to the present increasing temperature i shall mail some valuable tips containing the articles.
With regards…
Kalyanasundaram. A
Jr. Inspector of sericulture (Retd )
Government of Tamilnadu,
1/24- Vasthu nagar,
Pillanallur,
Gurusamypalayam – Post office,
Rasipuram – Circle,
Namakkal – District,
Tamilnadu state-India.
What is an “eviction ratio?”